
NOAA has issued a La Niña Watch for fall and winter 2017/18 in North America.
NOAA reports that there is a 55-60% chance of La Nina for winter 2017/18 (full details below).
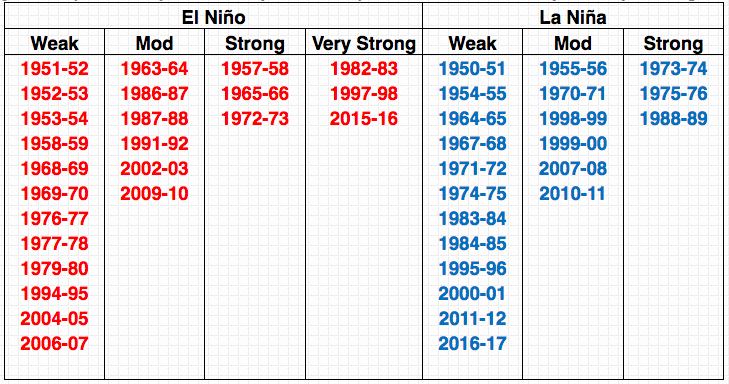
Two of the biggest snow seasons in recorded history in the Western USA were both La Ninas.
- 2010/11 was a moderate La Nina and the most snow Lake Tahoe ski resorts have ever recorded (857″ of snow at Mt. Baker, WA & 852″ at Alpine Meadows, CA).
- 2016/17 was a weak La Nina the 2nd most snow Lake Tahoe ski resorts have ever recorded (866″ at Mt. Baker, WA & 795″ at Sugar Bowl, CA ).
Needless to say, we like La Ninas.
In 2016/17 (a weak La Nina), 8 ski resorts in the USA saw over 700″ of snow!

September ENSO Update: La Niña Watch!
The September ENSO forecast is out!! (Can you tell I’m excited to be back on the top-of-the-month post?) Forecasters think there is an approximately 55-60% chance of La Niña this fall and winter, so we’re hoisting a La Niña Watch. Read on to find out what’s behind this development!
Summer summary
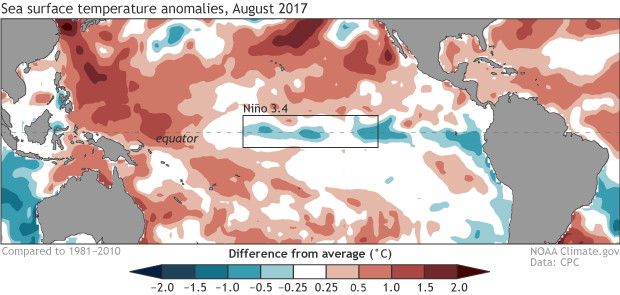
First, though, a quick recap of current conditions in the tropical Pacific Ocean. The sea surface temperature in our favorite Niño3.4 region in the central Pacific was about 0.1°C colder than the long-term average over June – August, smack-dab in the neutral range. The atmosphere also reflected neutral conditions during the summer, with the winds above the equatorial Pacific neither particularly enhanced nor weakened, and an average pattern in the clouds and rainfall.
While neutral prevailed during meteorological summer (what we call June – August, while the summer solstice through the vernal equinox is “astronomical summer”), we began to see some indications over the course of August that a change may be afoot. The first of these is the downward trend in central Pacific sea surface temperature anomalies (departure from the long-term mean) from July into August, with the August average in the Nino3.4 region of about -0.4°C, using ERSSTv4 data.
Winds and waves
One of the many environmental factors that we monitor closely is the temperature of the tropical Pacific below the surface of the ocean. Over the course of a couple of months, areas of cooler or warmer water can grow or move below the surface of the Pacific from west to east along the equator. These blobs (often in the form of oceanic Kelvin waves) often rise to the surface as they approach the eastern Pacific Ocean, and so give us a heads-up of how the surface may look in the near future.
It just so happens that during August, an area of cooler-than-average water developed around 50-150 meters (~160-500 feet) below the surface of the Pacific.
Subsurface Kelvin waves are triggered by changes in the wind at the surface. The trade winds normally blow from east to west across the surface of the equatorial Pacific, keeping warmer surface water trapped in the western Pacific Ocean. If the winds weaken or strengthen, they can sometimes—but not always; this is a complex system—kick off Kelvin waves. In the case of an upwelling Kelvin wave, such as what we saw over the last month, the winds across the equatorial Pacific have strengthened, pushing harder on the surface waters and allowing cooler water to upwell from the deep ocean.
Since fall of 2016, the overall wind pattern has tended toward slightly stronger-than-average trade winds in the central and western Pacific, with a brief interruption in April 2017. This pattern is a little La Niña-ish, despite a lack of cool sea surface waters, and it’s one of the reasons we didn’t have a lot of confidence this past spring in the climate model forecasts for El Niño.
During the second half of July, the trade winds puffed a bit harder over the western half of the Pacific, likely helping this current Kelvin wave form. The complexity of the ocean-atmosphere system, where changes in one feed back into the other, means it’s difficult to diagnose a “cause” of the strengthened trade winds. I caught up with Steve Baxter, one of our Madden-Julian Oscillation (MJO) experts here at the Climate Prediction Center. He said the stronger trade winds during July were likely related to a short-lived MJO, but the signal wasn’t very clear.
Model citizen
The other major factor playing into forecasters’ consensus that conditions are favorable for the development of El Niño or La Niña conditions within the next six months (the criteria for a La Niña Watch) are the forecasts from the dynamical computer models.
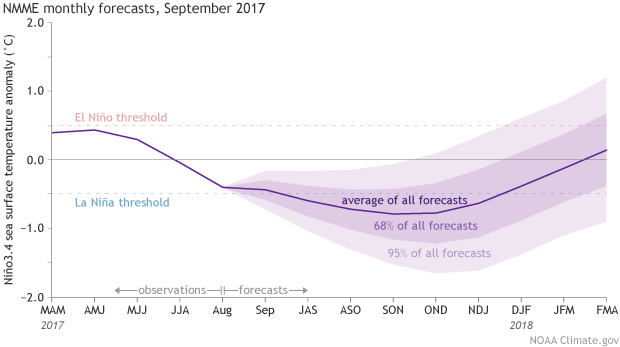
The ensemble of models from the North American Multi-Model Ensemble (NMME) is predicting that La Niña will develop this fall, and last just through the winter. Back-to-back La Niña winters are not uncommon, and have occurred at least five times since 1950, most recently in 2010-2011 and 2011-2012.
We are giving credence to the model forecasts because there is supporting physical evidence (that subsurface cooler water I was going on about a few paragraphs ago) and because September forecasts of Niño3.4 sea surface temperature have historically been fairly accurate.
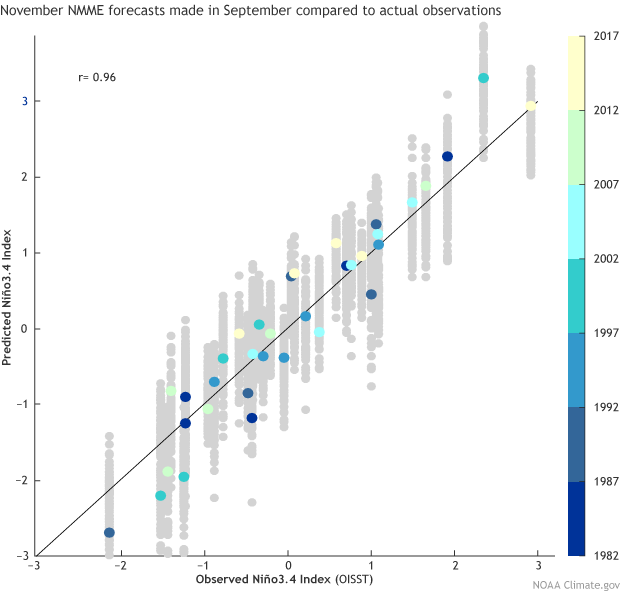
Michelle analyzed 36 years of predictions from the NMME, and found that September forecasts for November Niño3.4 sea surface temperatures have a strong relationship with what actually happened (0.96 correlation value, where 1.0 means they follow exactly). So, while they’re not perfect—if they were, all the colored dots would be exactly on the diagonal line—they’re usually reliable.
Watch on
In short, forecasters think that the sea surface in the Niño3.4 region will continue to cool, and the atmosphere will respond with a strengthened Walker circulation—the characteristics of La Niña. While chances of La Niña do have the edge in the current forecast, the odds only top out at about 60% likelihood that La Niña conditions will prevail in the winter. Climate forecasters will take this into consideration when developing the forecast for this coming winter, which will be released in October.
that means a fat dec for jhole.
you coming back miles?