
NOAA just dropped the chances of La Nina forming this winter from 75% to 55-60%.
“However, the 55-60% chance for La Niña represents a noticeable drop in probability from last month, which had peak probabilities of about 75%. Why the decrease? A typical cop-out answer would be “The ENSO forecast models now show a decrease in the likelihood, and also in the peak La Niña strength, and we trust them.” – NOAA, today
We’re hoping for La Nina because the last time we had a moderate La Nina (2011), this happened:
2010/11 “Strong La Nina” Snowfall Totals:
- Alpine Meadows, CA = 852″
- Squaw Valley, CA = 811″
- Mt. Baker, WA = 808″
- Alta, UT = 723″
- Mammoth, CA = 668″
- Mt. Bachelor, OR = 665″
- Whistler, B.C. = 622″
- Jackson Hole, WY = 557″
- Jay Peak, VT = 376″

July 2016 ENSO Discussion: Enjoy Neutral While It Lasts!
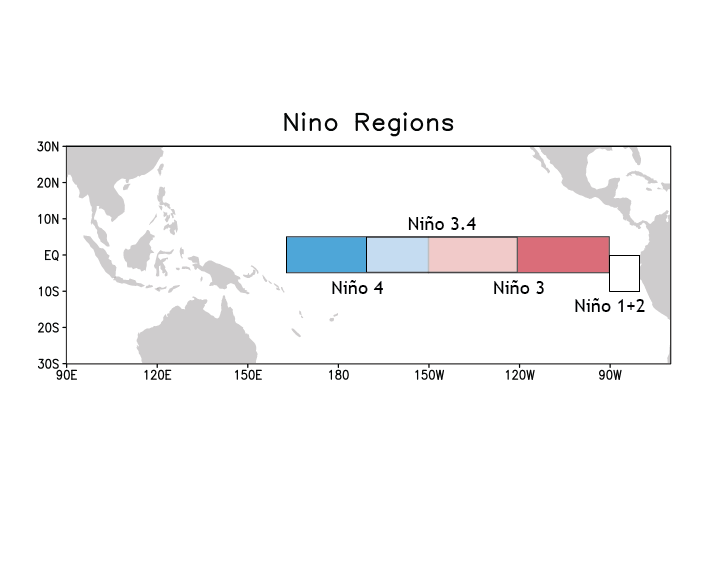
Neutral ENSO conditions reigned during June and so far in July, as the sea surface temperature in the Niño3.4 region, often used to measure the El Niño/La Niña (ENSO) state, was between -0.5°C and 0.5°C away from average. ENSO-neutral means forecasters can relax a bit, and phones are no longer ringing off the hook now that this whale of an El Niño finally bit the dust.

Sea surface temperature in June 2016 compared to the 1981-2010 average. Cooling in the central tropical Pacific confirms that El Niño is over and hints that La Niña may develop later this year, if the atmopshere responds. NOAA Climate.gov map by Dan Pisut (NOAA EVL), based on GEO-Polar data.
However, we can’t rest too much. During the last 60 or so years, strong El Niño years have often been followed by La Niña years. There are known physical reasons for this, which we have covered (here and here). Although the record is short, it appears the stronger the El Niño, the greater the chance for a La Niña the next year. And we just had a pretty strong El Niño!
Sure enough, forecasters currently believe there is an approximately 50% chance that sea surface temperatures for the Niño3.4 region will drop to at least -0.5°C below average (qualifying as a La Niña condition) during the August–October season, and a 55-60% chance for La Niña for the fall. Although 55-60% is far from a sure thing, it means that getting some grade of La Niña, even if just a weak one, is more likely than not.
At the moment, there is a good supply of cooler-than-average water below the surface in the central and eastern tropical Pacific. This cold water has been making contact with the surface along portions of this vast stretch of ocean right along the equator, and the Niño-3.4 index dropped into weakly negative territory by late June as a result.
Weakened Probabilities for La Niña
However, the 55-60% chance for La Niña represents a noticeable drop in probability from last month, which had peak probabilities of about 75%. Why the decrease? A typical cop-out answer would be “The ENSO forecast models now show a decrease in the likelihood, and also in the peak La Niña strength, and we trust them.”
But why are they showing the decrease? What are the models seeing that the sea gull of average intelligence flying over one of the TAO or Argo buoys in the eastern tropical Pacific might not see? Or that some egghead scientist sitting on the 13th floor of an ivory tower at a high-powered university overlooking a green hill might miss in eyeballing a dozen busy-looking charts and graphs?
First, let’s probe the obvious, and look at the recent monthly rate of decrease of the ocean temperature in the Niño3.4 region since the peak of the 2015-16 El Niño, in comparison with what happened following other past El Niño events—in particular, the very strong 1997-98 and 1982-83 events. The figure below shows the result.
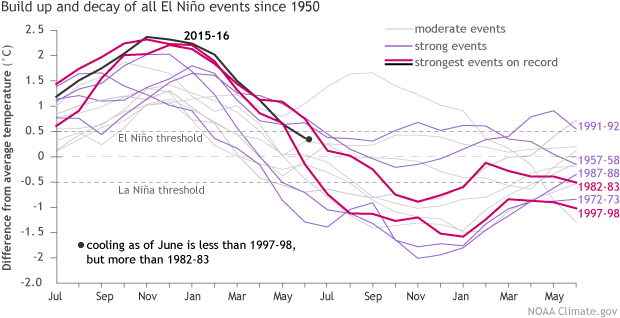
Temperatures in the Niño3.4 region of the tropical Pacific compared to the 1981-2010 average for 2015-16 (black line) and for other moderate-to-strong El Niño years since 1950. The two strongest previous events (1982-83 and 1997-98) are shown in magenta, four more strong events in purple, and the moderate events in light gray. The graph starts in July of the first year of El Niño and ends two years later in June. Climate.gov graph, based onERSSTv4 data.
We can see that between May and June this year, the temperature decrease lost pace with that of 1998, after more closely paralleling it up through May. Note that a significant La Niña developed by late summer 1998. However, this year’s rate of decrease has been steeper, so far, than the one in 1983, and a weak La Niña condition even emerged in late 1983 (but it didn’t last long enough to make in on NOAA/CPC’s official list). So far, we’re on a trajectory this year that is somewhere in between those two cases.
But looking carefully at the behavior of 1998, 1983 and other significant post-El Niño cases like 1973, 1992, 1958 and 1988, we see that monthly fluctuations in behavior may not mean much in the grander scheme of things. Remember that ENSO usually acts more on a seasonal time scale than a monthly one, although ENSO-relevant events can occur within a single month from time to time, such as when the MJO interacts with ENSO. We may not have cooled at a very fast rate between May and June, but could easily make up for it in the coming months. So then, why are the models weakening their forecasts at this point in time?
One likely answer is the delay in the expected onset of La Niña-like ocean-atmosphere coupling in the eastern tropical Pacific Ocean. What is coupling? To set the stage, cooler than average water currently sits beneath the surface, and is now impacting the surface across the eastern Pacific Ocean, as seen in the figure below.
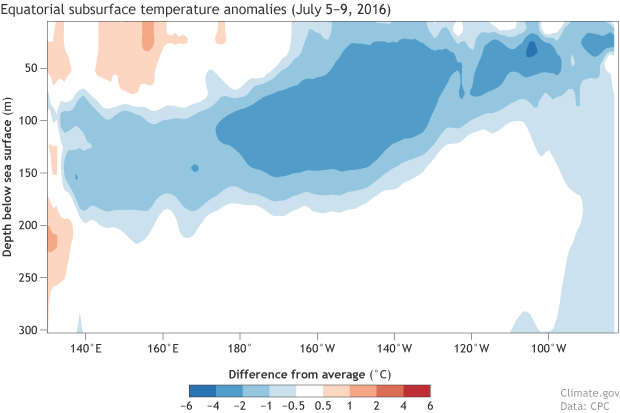
Departure from average of the surface and subsurface tropical Pacific sea temperature averaged over July 5-9 2016. The vertical axis is depth below the surface (meters) and the horizontal axis is longitude, from the western to eastern tropical Pacific. Values are for right along the equator. The massive volume of water of below-average temperature extends to the surface near 130°-150°W, and also near 105°W and 85°-90°W.
With below-average water temperature along the equator in the eastern tropical Pacific, we would expect some atmospheric coupling, such as enhanced trade winds that blow from the colder-than-average water in the east toward the warmer-than-average waters of the central and western Tropical Pacific. Sinking motion (higher surface pressure) tends to occur over anomalously cool water, with rising motion (lower pressure) over warm water. And surface winds blow from high toward low pressure. If the trade winds were to increase, they would cause upwelling of the even more anomalously cold waters from below the surface, which would then cause even stronger trade winds, and so on—the typical La Niña feedback loop. This is nothing more than a strengthening of the Walker circulation that typifies La Niña.
Enhanced Trades—Where Are You??
But the first nod toward above-average trade winds has not yet been observed, as we can see in the figure below. Trades are very close to average across most of the tropical Pacific.
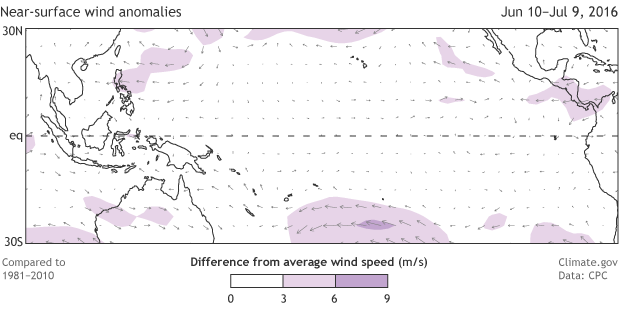
Departure from average low-level (850 hPa) winds across the tropical Pacific Ocean from June 10–July 9, 2016. Arrows show wind direction, and shading shows areas where the speed is different from zero to a noteworthy degree. Along the central and eastern equatorial Pacific, the trade winds were mostly average.
To get a La Niña started, someone—the ocean or the atmosphere—has to make the first move. The ocean has done that—the ocean surface has cooled somewhat, and appears to be “waiting” for some stronger surface winds to upwell still colder water. To get the La Niña to grow, we need more upwelling. It is the atmosphere’s turn to play ball. Is it going to kick in or isn’t it?
Climate forecast models, which look at the latest observations, are beginning to wonder the same thing. Therefore, they recently have become less bullish on the La Niña—both for the rate of onset and the peak strength later in 2016. But they are not forecasting a cancellation of the event, so we need to keep our eyes peeled over the coming weeks and months to see if we get some action.
This may be a bit trivial to ask here, but as a practical deduction, booking a vacation in the dominican republic coming september is a bad idea? Or is a possible la nina not starting to show such real life effects, as increased hurricane threat, until october?