As we move into the middle of January, it is looking like La Niña will end in February of 2017. This La Niña was relatively weak over the ocean and in the atmosphere, which left them in a constant state throughout. Although La Niña persisted through December and into January, it is expected that the effects of it could last well past February. Atmospheric rivers and other significant weather-related events could still occur because of the weather pattern. Above-average temperatures and below-median precipitation amounts are expected to occur once La Niña is gone.
“Synopsis: A transition to ENSO-neutral is expected to occur by February 2017, with ENSO-neutral then continuing through the first half of 2017.” – NOAA Today
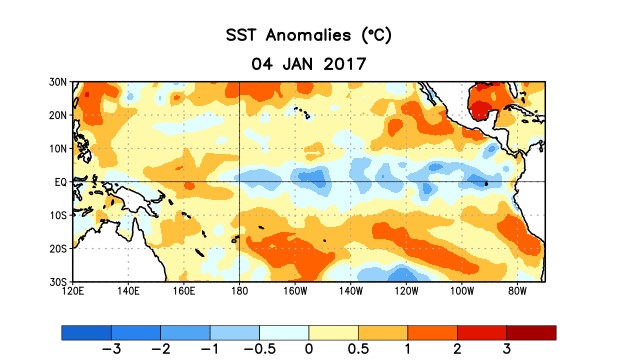
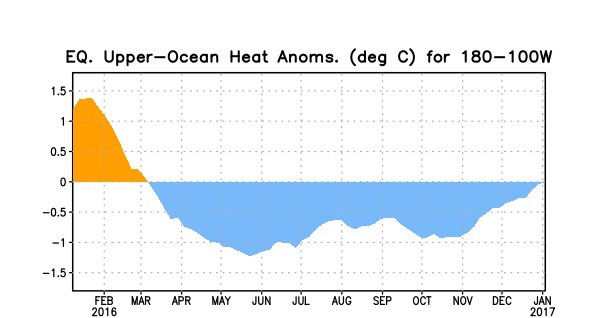
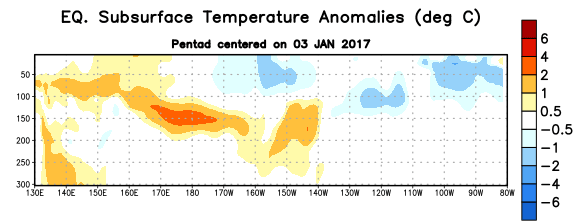
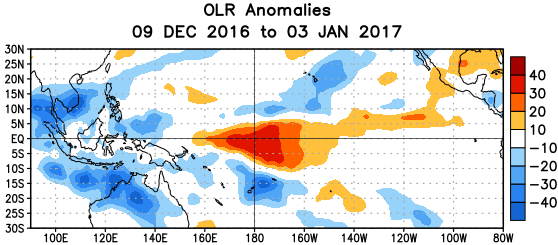
La Niña continued during December, with negative sea surface temperature (SST) anomalies continuing across the central and eastern equatorial Pacific (Fig. 1). The weekly Niño index values fluctuated during the last month, with the Niño-3 and Niño-3.4 regions hovering near and slightly warmer than -0.5°C (Fig. 2). The upper-ocean heat content anomaly was near zero when averaged across the eastern Pacific (Fig. 3), though near-to-below average subsurface temperatures were evident closer to the surface (Fig. 4). Atmospheric convection remained suppressed over the central tropical Pacific and enhanced over Indonesia (Fig. 5). The low-level easterly winds were slightly enhanced over the western Pacific, and upper-level westerly anomalies were observed across the eastern Pacific. Overall, the ocean and atmosphere system remained consistent with a weak La Niña.
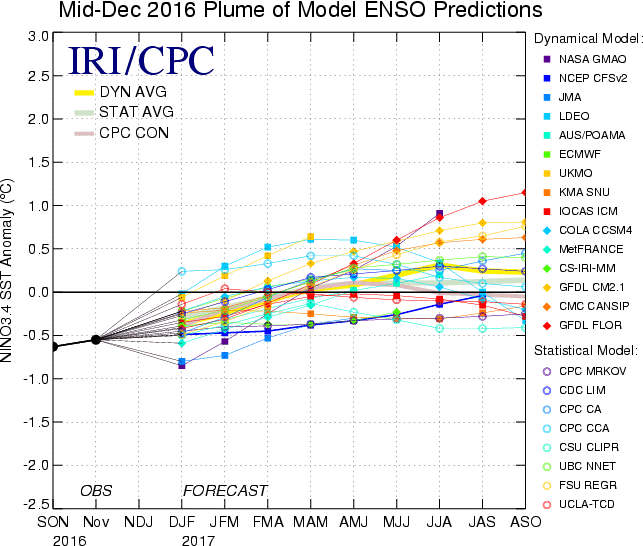
The multi-model averages favor an imminent transition to ENSO-neutral (3-month average Niño3.4 index between -0.5°C and 0.5°C), with ENSO-neutral lasting through August-October (ASO) 2017 (Fig. 6). Along with the model forecasts, the decay of the subsurface temperature anomalies and marginally cool conditions at and near the ocean surface portends the return of ENSO-neutral over the next month. In summary, a transition to ENSO-neutral is expected to occur by February 2017, with ENSO-neutral then continuing through the first half of 2017 (click CPC/IRI consensus forecast for the chance of each outcome for each 3-month period).
Even as the tropical Pacific Ocean returns to ENSO-neutral conditions, the atmospheric impacts from La Niña could persist during the upcoming months (NOAA’s 3-month seasonal outlook will be updated on Thursday January 19th). The current seasonal outlook for JFM 2017 favors above-average temperatures and below-median precipitation across much of the southern tier of the U.S., and below average temperatures and above-median precipitation in portions of the northern tier of the U.S.
![Figure 2. Time series of area-averaged sea surface temperature (SST) anomalies (°C) in the Niño regions [Niño-1+2 (0°-10°S, 90°W-80°W), Niño 3 (5°N-5°S, 150°W-90°W), Niño-3.4 (5°N-5°S, 170°W-120°W), Niño-4 (5ºN-5ºS , 150ºW-160ºE]. SST anomalies are departures from the 19812010 base period weekly means.](http://snowbrains.com/wp-content/uploads/2017/01/Nina-1-min.png)