
NOAA just released their latest El Nino update today. The current El Nino is now officially strong. Here are the highlights from their complex update:
- In coastal northern California, a strong El Niño year averages about 40 rainy days per winter (December 1st through February 28th), compared to about 26 during a non-El Niño winter.
- In the northern Rocky Mountains, a strong El Nino year averages less precipitation days per winter (Dec. 1 – Feb 28th) compared to a non-El Nino winter.
Check out the second graph below to see the data above in graphic form.
***
October 2015 El Niño update: Pumpkin spice
As we approach peak pumpkin spice latte season, we’re also closing in on the peak of the 2015-2016 El Niño, expected by forecasters to occur in the late fall or early winter.
This El Niño continues to rank among the strongest in our records, which start in 1950. The July-September 3-month average sea surface temperature (the ONI) was 1.5°C above normal, third in line behind July-September 1987 (1.6°C) and 1997 (1.7°C). The atmospheric response to the warmer-than-average sea surface temperatures is keeping pace, too: the Equatorial Southern Oscillation Index (EQSOI) is -2.2. This is second to 1997’s -2.6, and well ahead of the next two El Niños on the list (1972 and 1982, tied at -1.4).

The near-surface winds along the equator in the Pacific, which are important for maintaining the sea surface temperature anomalies, have lagged a bit behind the stronger El Niños so far. These winds, which blow from east to west under normal conditions, weaken during El Niño, allowing the warmer water in the western Pacific to move into the central and eastern regions. In 1997-98, the strongest event on record, the winds in the central Pacific weakened so much they reversed, and blew from west to east during October and November. This September did have consistently weaker-than-average winds, though, and October has started off with a strong westerly wind burst. We’ll be watching this region closely in the upcoming months.
Of seasonal averages and suchlike things
The Climate Prediction Center’s official seasonal forecasts for winter 2015-2016 give you an indication of what can be expected for the three-month average. For example, the forecast made in September shows a 70% probability that most of Florida can expect rain in the upper one-third of its historical record. The past history of El Niño events is a big factor in this forecast, and you may notice that the forecast looks similar to the map of December-February El Niño precipitation anomalies. Not exactly the same, because a lot of other factors go into the official forecast, but El Niño is the strongest signal.
This means that past El Niño winters can give us an idea of what we might expect for this winter. So I’m going to dig into some of these past winters to see how different from average they were in terms of daily weather. Some of the things we can consider are the number of rainy/snowy days in the season, or the number of days with heavy precipitation. (I’ll stick with “precipitation,” since the data I’m looking at are rain and water-equivalent snow.)
Since every El Niño event is different, this definitely isn’t a forecast—anyway, it’s impossible to forecast the exact number of rainy days. But it’s interesting to know what a season with “above -average” precipitation might mean to those of us who will experience the weather day to day.
In a post on our sister blog, Beyond the Data, Deke Arndt discussed how you might go into an El Niño expecting one thing (lots of rain!) but get another (uh, it’s kinda dry…) He illustrated how the average of six strong El Niños can cover up a lot of year-to-year variability, which is a very important point that applies here, too. You can expect one outcome, but know you may get another. We have maps showing the average precipitation during every El Niño winter on record; you can look at these and immediately tell that there is a LOT of variation.
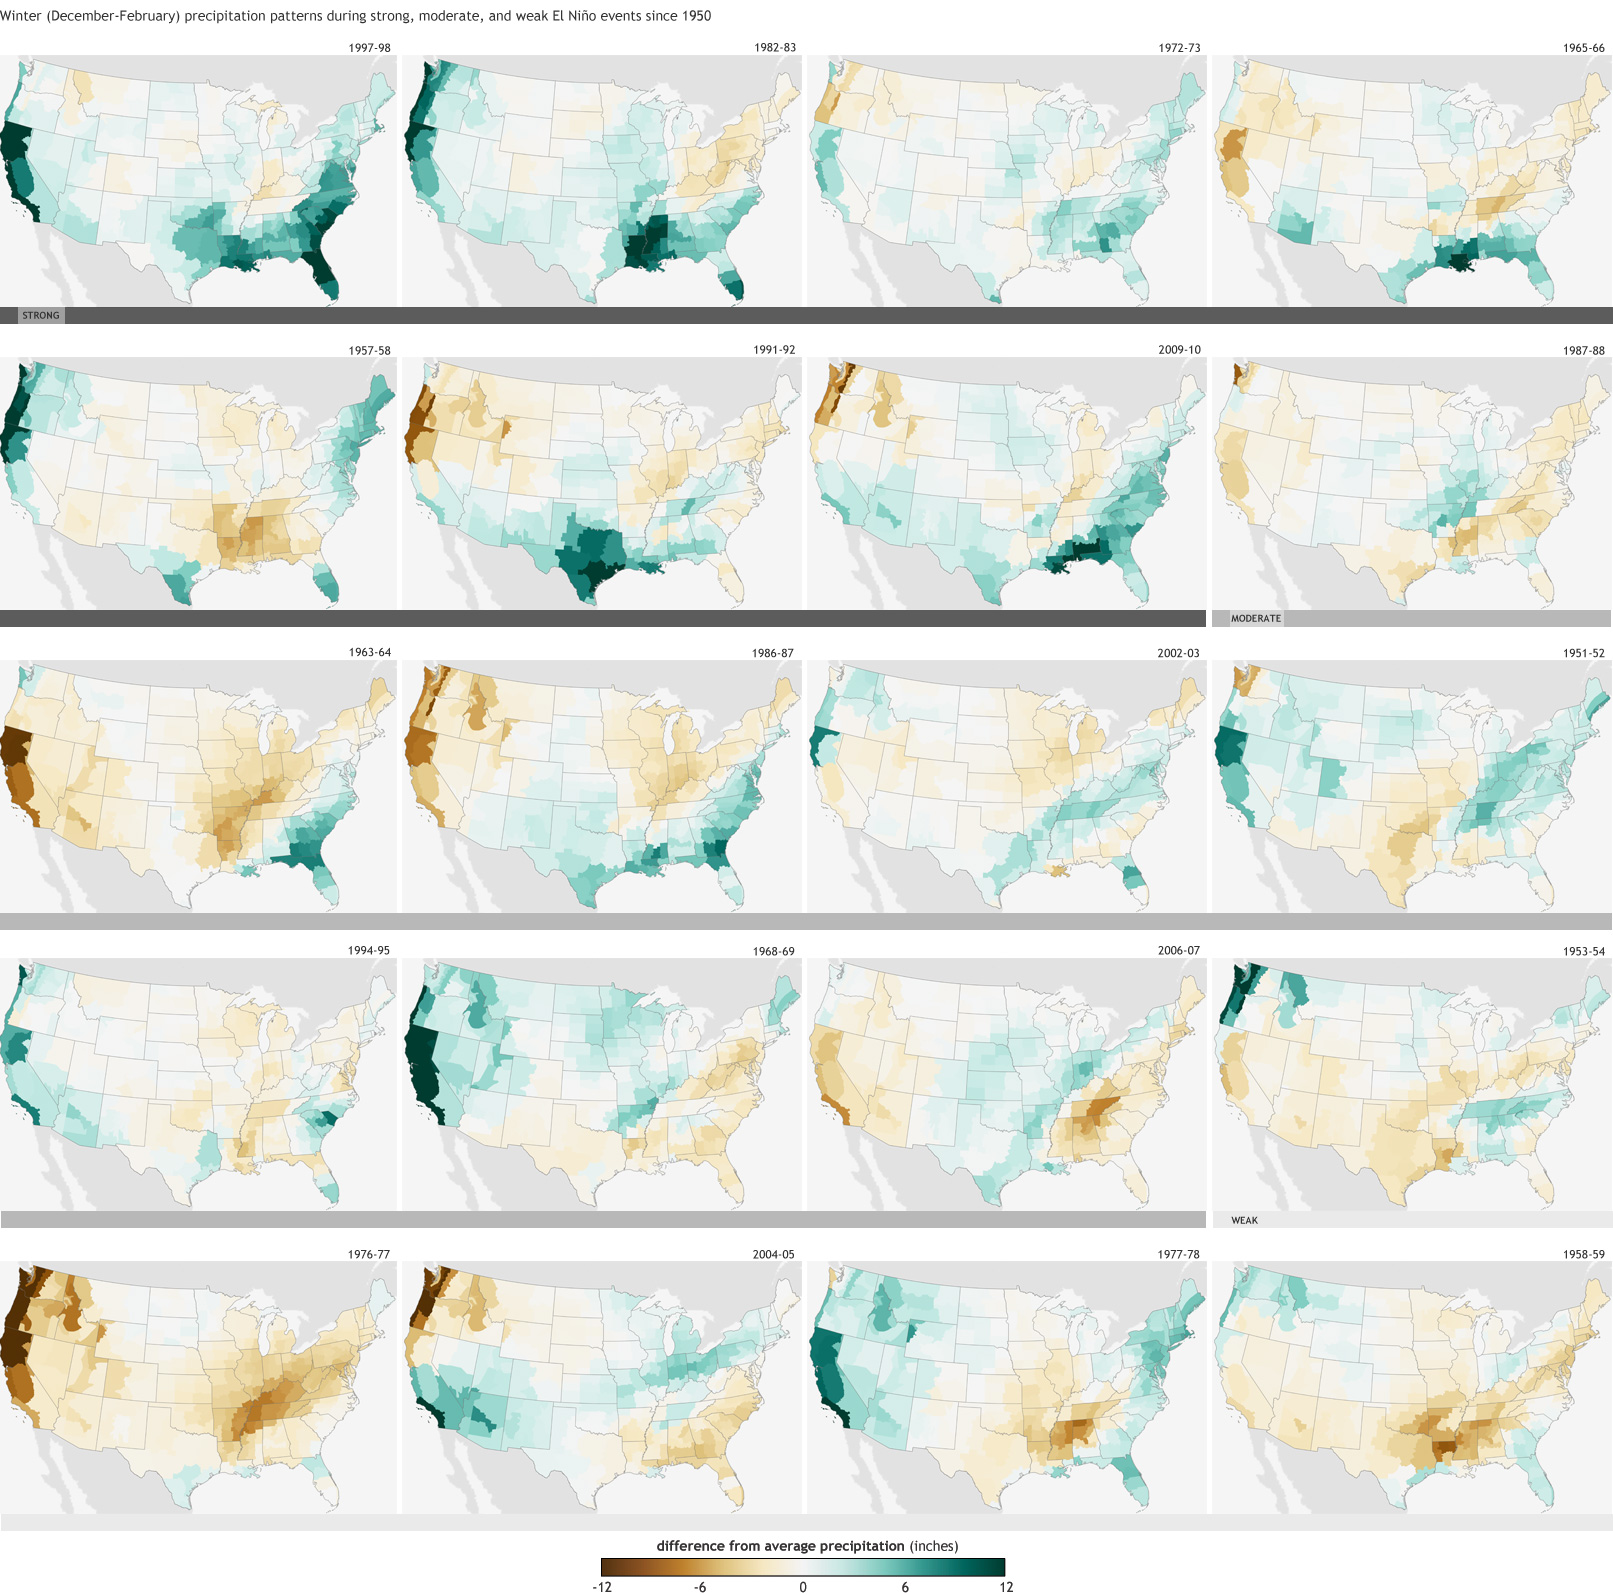
Enough cautioning! To make the map below, I averaged the number of rainy days (here defined as a day with more than 0.1 inch of precipitation) during winter for six strong El Niño events: 1957-58, 1965-66, 1972-73, 1982-83, 1991-92, and 1997-98. This I compared to the number of rainy days during the 41 non-El Niño winters (either neutral or La Niña conditions). With apologies to Hawaii, Alaska, Canada, Mexico, and the rest of the world—the best data I had on hand only covers the continental United States.

In coastal northern California, a strong El Niño year averages about 40 rainy days per winter (December 1st through February 28th), compared to about 26 during a non-El Niño winter. Of the six strong El Niño years in our record, only one winter (1965) had fewer rainy days than the non-El Niño average. In southwest Florida, all six strong El Niño winters had more rainy days than the average of years without El Niño, although 1991-92 was only slightly above.
Heavy precipitation (defined here as days with more than 1” of rain or water-equivalent snow) can show more dramatic changes. For example, in south Louisiana, the overall number of days with rain increases from about 21 for a non-El Niño year to 29 for a strong El Niño year, but the number of days with heavy rain more than doubles, from 4 to about 8.5. Two of the El Niño years had about the average number of days with heavy rain, while four had nine or more.

Fist of Flurry
Here’s a fun fact for your next nerdy cocktail party… Boulder, Colorado has registered seven October snowstorms with more than one foot of snow since 1950, every one happening during an El Niño winter. Snowstorms are really complex weather events that are difficult to forecast, even just a few days in advance, so this isn’t to say that Boulder should expect a big snowstorm this month. However, thanks to El Niño, the odds are tilted toward greater-than-average rain or snow in Colorado, and much of the southern half of the country, in late fall and early winter.
We’re moving into the seasons when we’ll see the greatest impacts from this strong El Niño event, so stay tuned to your local weather forecast office. It’s always a good idea to pay attention to the weather forecast, but especially so with this strong El Niño in place.