
NOAA just released their updated 2014/15 Winter Weather Outlook for the USA. One cool new thing is that this time they gave us “percentage chances”. This means that in the pie charts in the graphs, we can see what the chances are that what they are forecasting may happen.
The graphs are great and the write is extremely wordy. What they’re trying to say in the write up is this:

2014/15 NOAA Winter Weather Outlook Breakdown:
– South Alaska and the Southern US have 43% chance of having above average precipitation this winter. This is potentially good for Mammoth, Big Bear, Taos, Telluride, Silverton, & Wolf Creek.
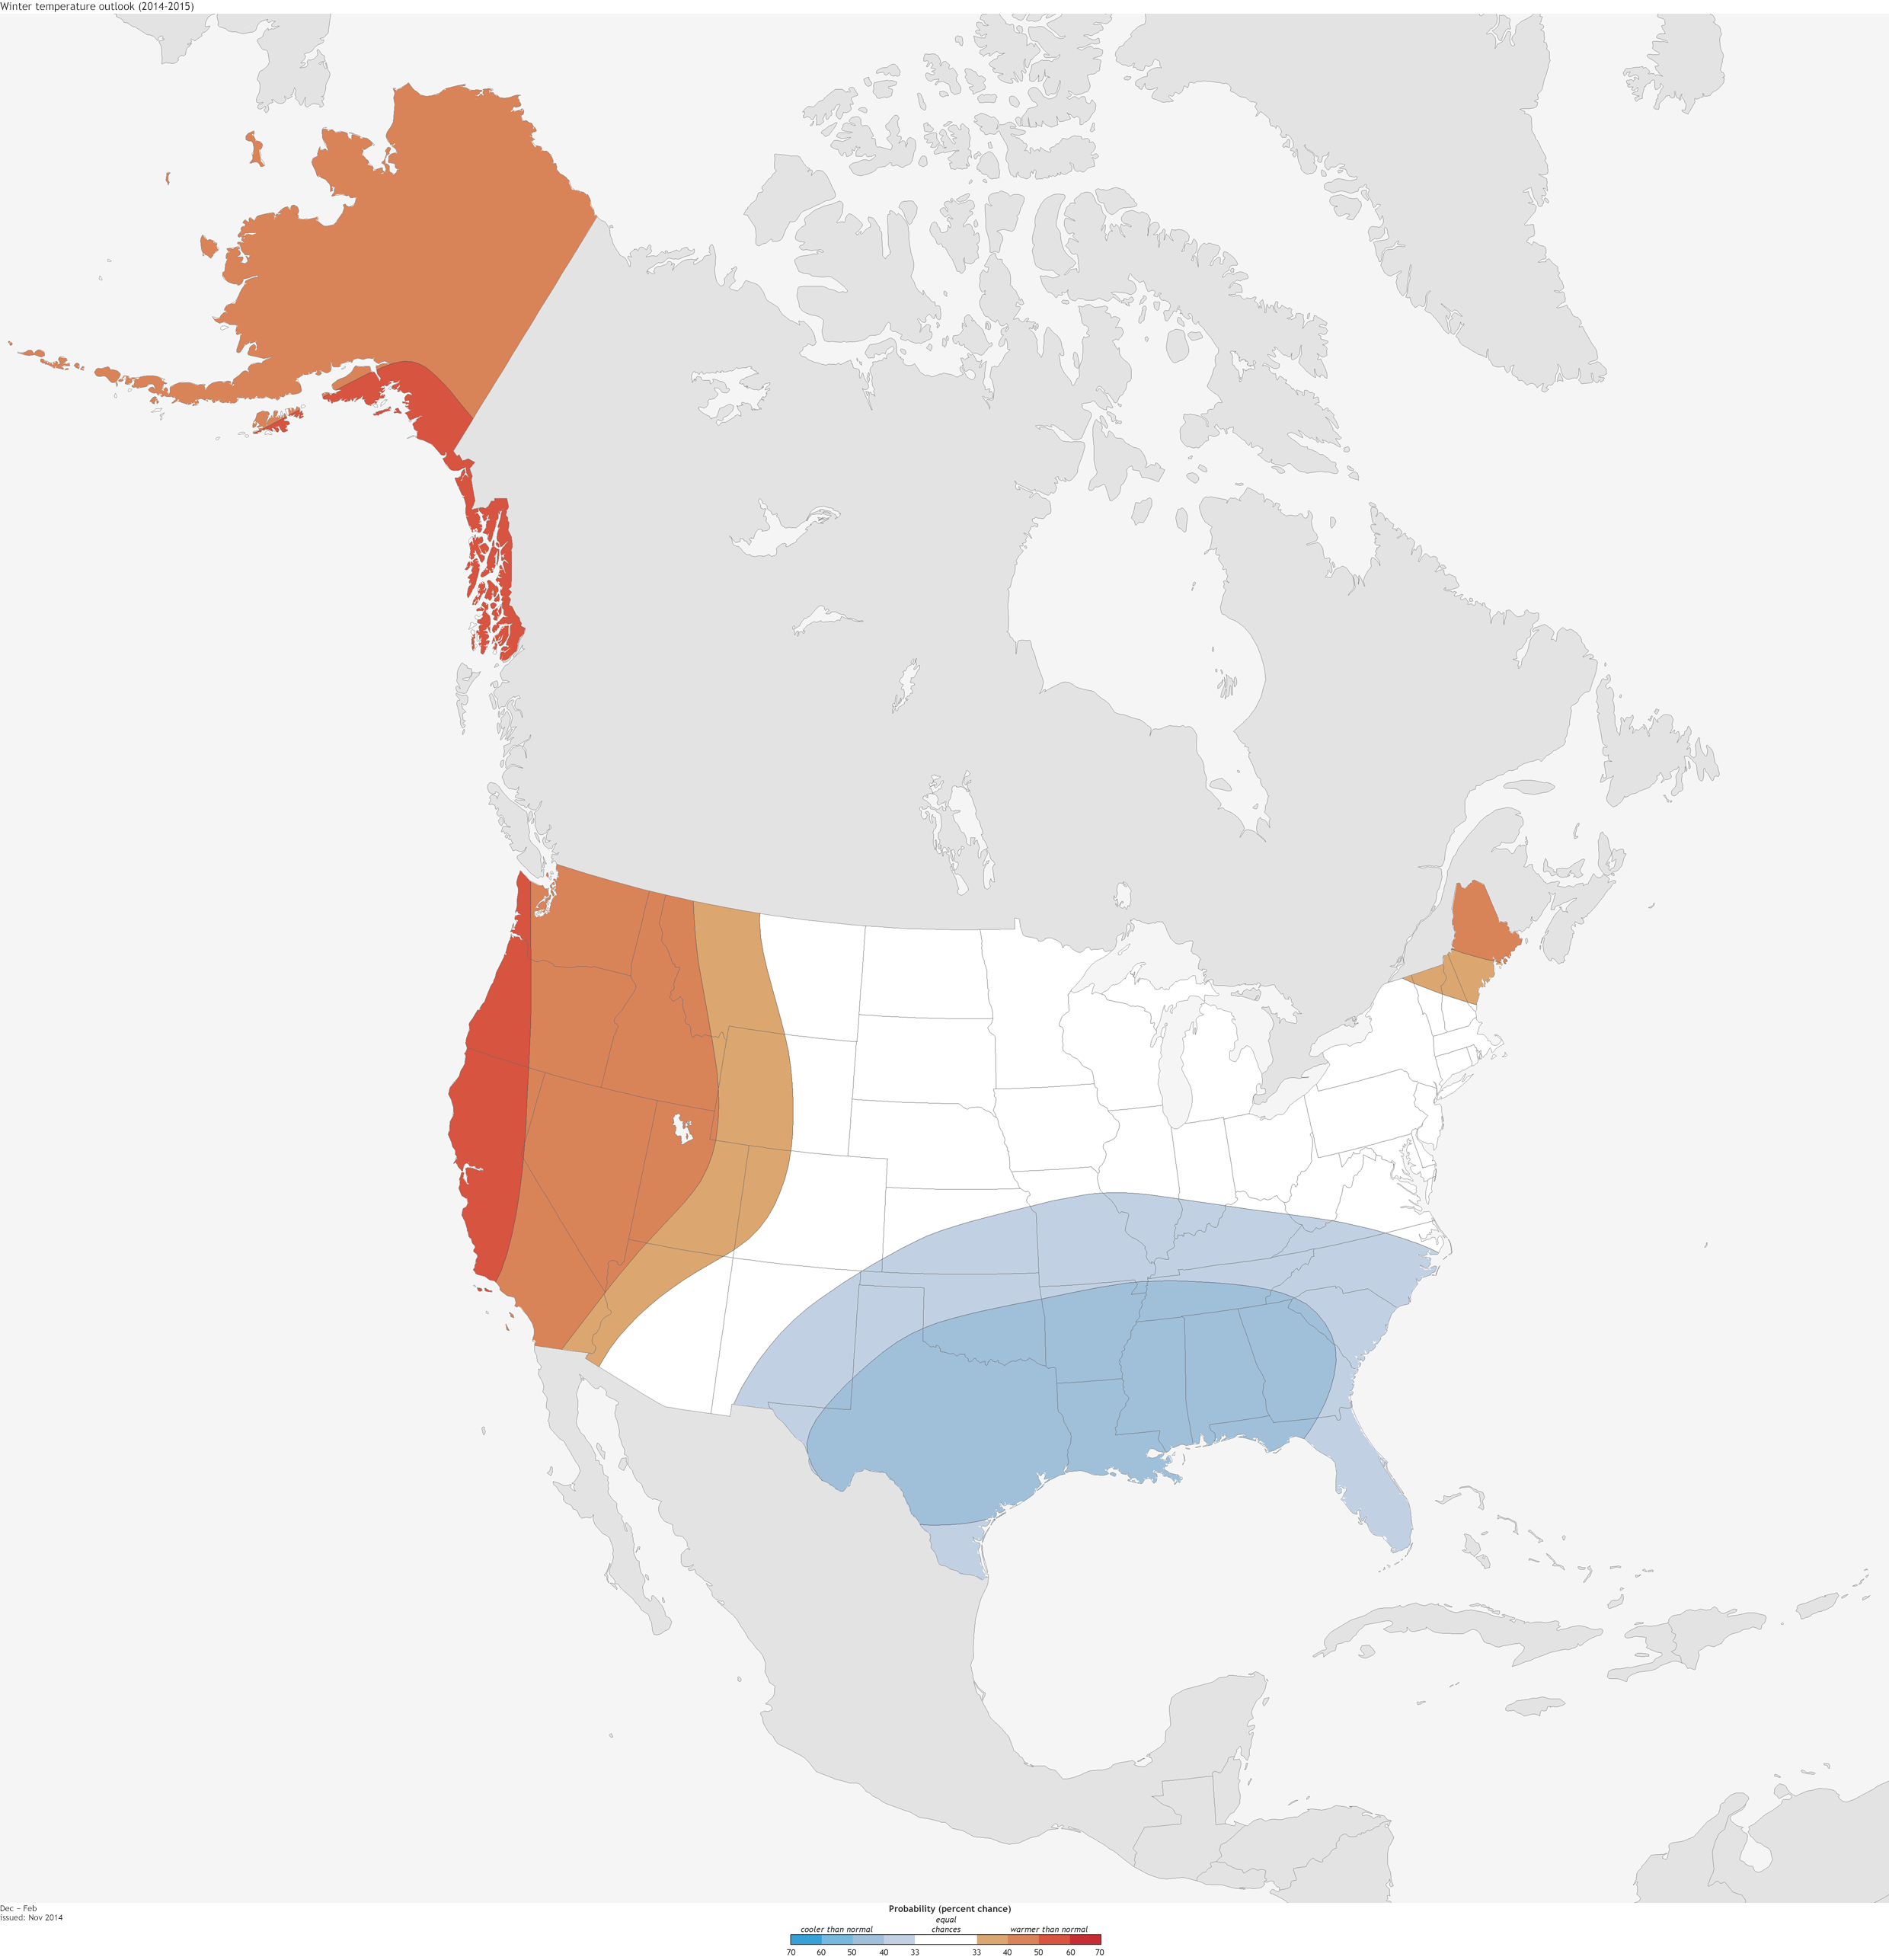
– All of Alaska and all of the Western States have a 52% chance of above average temperatures this winter. This is potentially bad for CA, OR, WA, ID, NV, UT, WY, and MT.
– El Nino has not begun yet. Despite this the NOAA outlook shows an El Nino pattern as it is still slightly favored.
– El Nino now only has a 58% chance of appearing this winter.
– The only ski state with predicted below average temps is New Mexico.
– Going solely off this outlook, Taos, NM would be the place to be this winter.
NOAA’s Full 2014/15 Winter Weather Outlook for the USA:
After a memorably cold winter in the central and eastern United States last year, and some very cold weather this month, folks are likely wondering if this cold weather is a harbinger of things to come. The simple answer is “not necessarily,” as the persistence of weather and climate from one winter to the next or even one month to the next is usually fairly low (Livezey and Barnston 1988; Barnston and Livezey 1989; Van den Dool 1994). While “persistence”—the prediction that recent conditions will continue—is a simple forecast to make, it rarely proves to be as accurate as forecasts made using dynamical models or more advanced statistical methods (1).
So does that mean this won’t be a cold winter in the central and eastern part of the nation? Again the answer is “not necessarily.” According to the NOAA Climate Prediction Center (CPC) mid-November outlook, odds favor below-normal temperatures in certain parts of the country, and many of those areas do turn out to be in the south-central and southeastern United States, as we will discuss shortly.
Furthermore, and perhaps more importantly, even in regions where above-normal temperatures are favored, a colder-than-normal winter is still a possibility. Remember, CPC’s outlooks describe probabilities, which means—as we’ve explained in earlier blog posts—that even when one outcome is more likely than another, there is still always a chance that a less favored outcome will occur.
The El Niño-Southern Oscillation (ENSO) provides strong clues as to what we can expect during winter across much of the United States. Of course, this only applies when El Niño or La Niña are present, and as we approach winter, we find ourselves still waiting and wondering if El Niño is going to begin or not. However, despite the reluctance of El Niño to show itself so far this year, CPC forecasters have considered potential impacts from El Niño and have slightly tilted the outlook (particularly the precipitation outlook) in that direction.
And if El Niño remains a no-show this year, what will this mean for the forecast? Actually, as you might expect, not much, because the forecasters understand the fact that El Niño has a 58% of developing, which also means that there’s a 42% chance that it won’t. To see how information about El Niño gets incorporated into the forecast, let’s take a look at the precipitation outlook. (El Niño often has a more robust influence on precipitation than on temperature.)
The winter precipitation outlook favors wetter-than-normal conditions across the southern tier of the nation extending northward along the East Coast, as well as in southern Alaska, and drier-than-normal conditions in central Alaska, parts of the Pacific Northwest and around the Great Lakes and Ohio Valley. This pattern is quite consistent with the average precipitation patterns seen during previous El Nino winters.

However, you’ll note that the largest probabilities on this outlook are all less than 50%. This means that while above-normal precipitation across the South is the most likely out of the 3 possibilities (below normal, near normal, or above normal), it’s more likely that we’ll see precipitation that is “not above-normal.” That is, the combined chance that the outcome will fall in one of the other two categories (near normal or below normal) is higher.
It’s like spinning a climate roulette wheel. While the “above” area is the biggest piece of the pie, the near-normal and even below-normal areas are not insignificant and could occur. These are very modest probabilities for an El Niño winter and reflect the reality that El Niño is not a sure bet for this winter. And even if it does develop, it’s likely to be a weak event, resulting in weak impacts.
For example, in contrast to this year’s ENSO situation, precipitation probabilities in Texas and Florida during the 2009-10 winter outlook exceeded 50% for above-normal rainfall, and they exceeded 70% during the peak of the 1997/98 event. In both cases, the most likely or favored result occurred, as wetter-than-average winters prevailed. This year our confidence level is not so high, but we still think the probability for above normal is higher than it would be purely due to chance, which would be 33.33%.
The temperature outlook favors a warmer-than-normal winter over Alaska, the Western United States, and northern New England, while below-normal temperatures are favored across much of the south-central (2) and southeastern parts of the nation. Probabilities of above-normal temperature exceed 50% along the West Coast, so this region has a significantly reduced chance (just 15%, according to the pie chart) of seeing a colder-than-normal winter.
Also note that both maps include areas where neither above- nor below-normal conditions is favored. Those areas are shown in white, which represents “equal chances,” and it means that the odds for above, near, or below-normal are all the same (33.33%). This doesn’t mean that temperature or precipitation is expected to be normal this winter in those regions (the probability for that is also 33.33%), but rather that there’s no tilt in the odds toward any of the three categories. Thinking back to the roulette wheel, the areas of each region would be the same, so the likelihood of any of the three categories occurring is also the same.
Making seasonal forecasts is a very challenging endeavor. Seasonal climate models are not as skillful as weather models, and phenomenon like El Niño or La Niña only provide some hints as to what might occur during an upcoming season. CPC issues probabilistic seasonal forecasts so users can take risk and opportunities into account when making climate-sensitive decisions.
However, keep in mind that these outlooks will primarily benefit those who play the long game. The maps show only the most likely outcome where there is greater confidence, but not the only possible outcome. For example, while the outlook favors above-normal temperatures in northern New England, it wouldn’t be shocking for temperatures this winter to be near-normal or even colder-than-normal. I just wouldn’t bet on it.
Footnotes
(1) However, persistence nonetheless does tend to show positive skill (i.e., it is better than just randomly guessing, or just forecasting near-normal every time), and month-to-month persistence is more likely within seasons with an El Nino or La Nina event (in locations that are influenced by ENSO).
(2) Note that this means states like Texas, Louisiana, and a few other southeastern states stand a better than average chance of experiencing a repeat of last year’s below-normal temperatures.
That’s funny cuz last time I checked Canada was not part of the USA. Read the title of the article!
Real cool how they neatly cut canada out of all the maps