NOAA just released their latest El Nino update. They’re calling it Supercalifragilisticexpealidocious, which we think is a good sign.
They expect that the current El Nino will peak in late fall/early winter and that it will be one of the strongest El Nino ever recorded.
NOAA is giving California good odds for an above average winter this year:
“California will receive above- normal, near-normal, or below-normal rainfall in winter (For example, in any random non-ENSO year, the chances that southern California will receive above- normal, near-normal, or below-normal rainfall in winter (December – February) are equal: 33.3% above normal, 33.3% near normal, and 33.3% below normal. During a strong El Niño year, these odds might shift to, say, 60% chance of above, 30% chance of near normal, and 10% chance of below. (This is just an example, not an official forecast!)” – NOAA
August 2015 El Niño update: Supercalifragilisticexpealidocious
As of August, NOAA and IRI forecasters are predicting this El Niño will peak in the late fall/early winter with 3-month-average sea surface temperatures in the Niño3.4 region near or exceeding 2.0°C (3.6°F) above normal. If this forecast comes true, it will place the 2015 event among the strongest El Niños in the (admittedly short) 1950-2015 historical record. What would this mean for expected impacts in the United States?
But first, this status update!
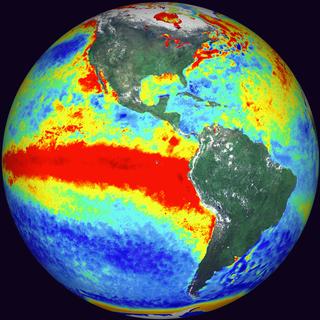
Sea surface temperature anomalies (departures from the long-term average) increased in much of the equatorial Pacific during July. The July average in the Niño3.4 region was +1.2°C above normal according to the ERSST monitoring datasets. The atmospheric features observed in the equatorial Pacific region during July show that the El Niño ocean-atmosphere coupling is cranking along: easterly winds near the surface were consistently weaker than normal, as were the westerly winds in the upper levels of the atmosphere, and satellites saw more clouds than average in the central and eastern Pacific.

Sea surface temperatures in the tropical Pacific: departure from the 1981-2010 average. CPC image.
The atmospheric response provides not just evidence that El Niño is strengthening, but confidence that it will continue to develop because the weakened near-surface easterly winds allow the surface waters to warm. Another near-surface westerly wind burst occurred in the western Pacific in late July, which will probably further reinforce the reservoir of warmer subsurface waters. The strongest El Niño events have all had very consistent near-surface wind anomalies across the tropical Pacific that lasted through the summer and fall.

Recent average winds near the surface of the tropical Pacific: departure from the 30-year average. Purple shading area indicates where the normally easterly (blowing from east to west) winds are weaker than normal.CPC image.
How much does strength matter to El Niño impacts?
El Niño is a climate pattern located in the tropical Pacific, so it doesn’t affect U.S. weather directly. Rather, it changes the larger-scale flow or circulation of the atmosphere. Warmer tropical Pacific waters release more heat to the atmosphere, causing more rising air and storminess in the central and eastern tropics. The rising air moves north (and south) away from the tropics, traveling to the mid-latitudes, where it shifts the North Pacific jet stream farther southward and eastward. Movement and extension of the jet stream can bring more storms to the United States, and change the seasonal temperature and precipitation patterns. For a great explanation of the way this works, check out Tony’s post.
The point of mentioning this is that there are a lot of complex mechanics behind how El Niño affects U. S. weather. There is a domino effect that arises from the warmer surface waters in the tropical Pacific, and small changes in how later dominos fall can ultimately determine exactly what will happen over the U.S. While we have more confidence in general impacts over the U.S. in an El Niño because of the shifts in the jet stream, they’re not guaranteed, because the ultimate result will also depend on factors (chaos & other climate patterns) that are not predictable months in advance and can also impact the jet stream and large scale atmospheric flow.
This is why we keep saying that El Niño “tilts the odds” for weather and climate impacts. For example, in any random non-ENSO year, the chances that southern California will receive above- normal, near-normal, or below-normal rainfall in winter (December – February) are equal: 33.3% above normal, 33.3% near normal, and 33.3% below normal. During a strong El Niño year, these odds might shift to, say, 60% chance of above, 30% chance of near normal, and 10% chance of below. (This is just an example, not an official forecast!)

An example of how a strong El Niño could shift the odds for the amount of seasonal precipitation.
In other words, even a strong El Niño is not a sure-fire drought-buster for California (Tom wrote about this last year; and Mike covered it as well), so it’s not time to stop conserving water, especially given how entrenched this drought is (i.e. it will likely take more than one good year to erase). However, a strong El Niño does increase the chance of more precipitation overall during the winter, and also brings the potential for extreme rainfall. This may help alleviate the drought, but also can also lead to mudslides and flooding.
So at the Climate Prediction Center we’re not spending a lot of time debating about if El Niño Bruce Lee will be the strongest El Niño in history, or the second-strongest, or the third, etc. A strong event increases the probability that the U.S. will experience weather and climate impacts, but the strength of the event does not map directly on to the strength of the impacts.

Winter precipitation (December-February) in 1982-83 and 1965-66—two strong El Niño events—compared to the 1981-2010 average. The winter of 1982-83 showed the “classic” wet signal that El Niño often brings to California, but the winter of 1965-66 did not. Maps by NOAA Climate.gov, based on NCEI climate division data provided by the Physical Sciences Division at NOAA ESRL.
We have a relatively confident forecast for a strong event, and this provides long-range forecasters with information they can use to develop their seasonal forecasts. So, although there are no guarantees, the odds nonetheless really are tilted in specific directions in various parts of the U.S. as far as winter climate is concerned. A significant El Nino like this one provides an uncommon opportunity for people to anticipate the climate tendency well in advance of the main impact season.
“California will receive above- normal, near-normal, or below-normal rainfall in winter”
They really went out on a limb with that…