This article originally appeared on climate.gov
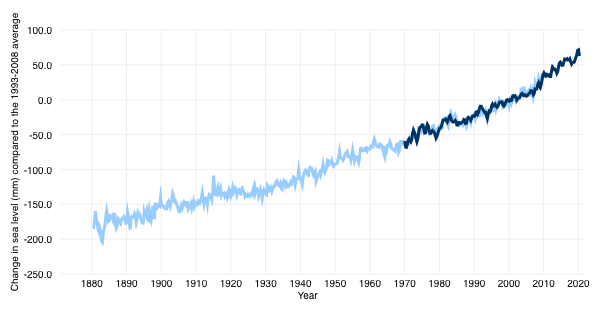
Global mean sea-level has risen about 8–9 inches (21–24 centimeters) since 1880, with about a third of that coming in just the last two and a half decades. The rising water level is mostly due to a combination of meltwater from glaciers and ice sheets and thermal expansion of seawater as it warms. In 2019, the global mean sea level was 3.4 inches (87.61 mm centimeters) above the 1993 average—the highest annual average in the satellite record (1993-present). From 2018 to 2019, the global sea level rose by 0.24 inches (6.1 millimeters).
Sea level since 1880
The global mean water level in the ocean rose by 0.14 inches (3.6 millimeters) per year from 2006–2015, which was 2.5 times the average rate of 0.06 inches (1.4 millimeters) per year throughout most of the twentieth century. By the end of the century, global mean sea level is likely to rise at least one foot (0.3 meters) above 2000 levels, even if greenhouse gas emissions follow a relatively low pathway in the coming decades.
In some ocean basins, sea level rise has been as much as 6-8 inches (15-20 centimeters) since the start of the satellite record. Regional differences exist because of natural variability in the strength of winds and ocean currents, which influence how much and where the deeper layers of the ocean store heat.
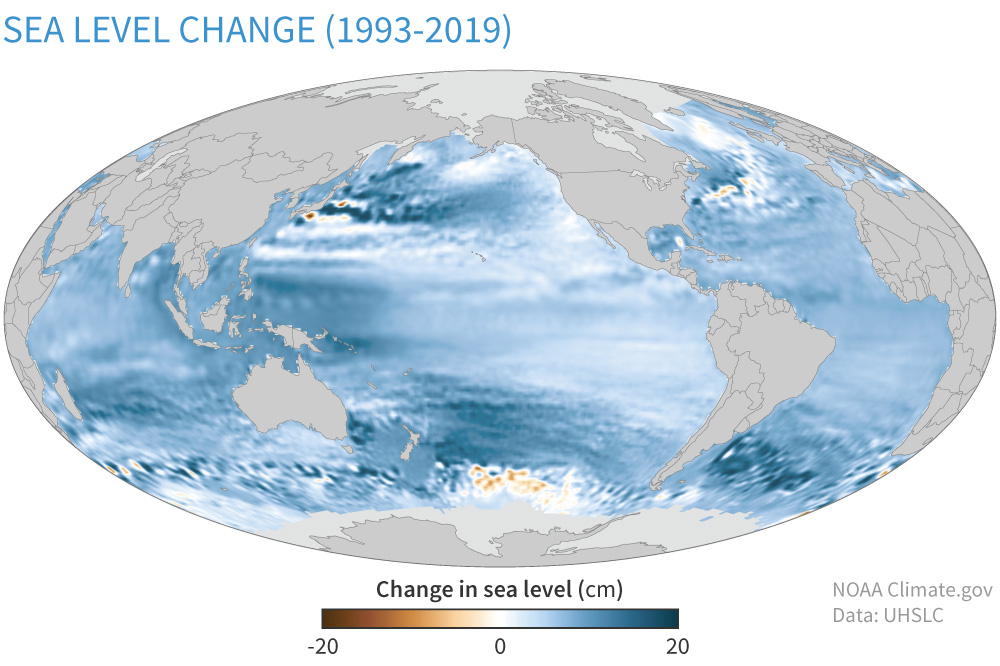
Past and future sea-level rise at specific locations on land may be more or less than the global average due to local factors: ground settling, upstream flood control, erosion, regional ocean currents, and whether the land is still rebounding from the compressive weight of Ice Age glaciers. In the United States, the fastest rates of sea-level rise are occurring in the Gulf of Mexico from the mouth of the Mississippi westward, followed by the mid-Atlantic. Only in Alaska and a few places in the Pacific Northwest are sea levels falling, though that trend will reverse under high greenhouse gas emission pathways.
In some ocean basins, sea level rise has been as much as 6-8 inches (15-20 centimeters) since the start of the satellite record in 1993.
Why sea level matters
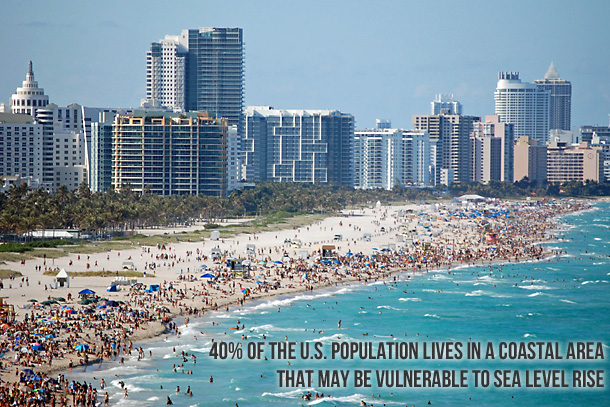
In the United States, almost 40 percent of the population lives in relatively high population-density coastal areas, where sea level plays a role in flooding, shoreline erosion, and hazards from storms. Globally, 8 of the world’s 10 largest cities are near a coast, according to the U.N. Atlas of the Oceans.
In urban settings along coastlines around the world, rising seas threaten infrastructure necessary for local jobs and regional industries. Roads, bridges, subways, water supplies, oil and gas wells, power plants, sewage treatment plants, landfills—the list is practically endless—are all at risk from sea-level rise.
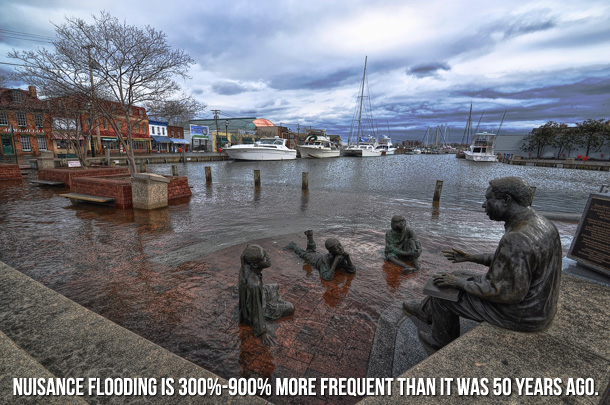
Higher background water levels mean that deadly and destructive storm surges, such as those associated with Hurricane Katrina, “Superstorm” Sandy, and Hurricane Michael—push farther inland than they once did. Higher sea level also means more frequent high-tide flooding, sometimes called “nuisance flooding” because it isn’t generally deadly or dangerous, but it can be disruptive and expensive. (Explore past and future frequency of high-tide flooding at U.S. locations with the Climate Explorer, part of the U.S. Climate Resilience Toolkit.)
In the natural world, rising sea level creates stress on coastal ecosystems that provide recreation, protection from storms, and habitat for fish and wildlife, including commercially valuable fisheries. As seas rise, saltwater is also contaminating freshwater aquifers, many of which sustain municipal and agricultural water supplies and natural ecosystems.
What’s causing sea level to rise?
Global warming is causing the global mean sea level to rise in two ways. First, glaciers and ice sheets worldwide are melting and adding water to the ocean. Second, the volume of the ocean is expanding as the water warms. A third, much smaller contributor to sea-level rise is a decline in the amount of liquid water on land—aquifers, lakes and reservoirs, rivers, soil moisture. This shift of liquid water from land to ocean is largely due to groundwater pumping.
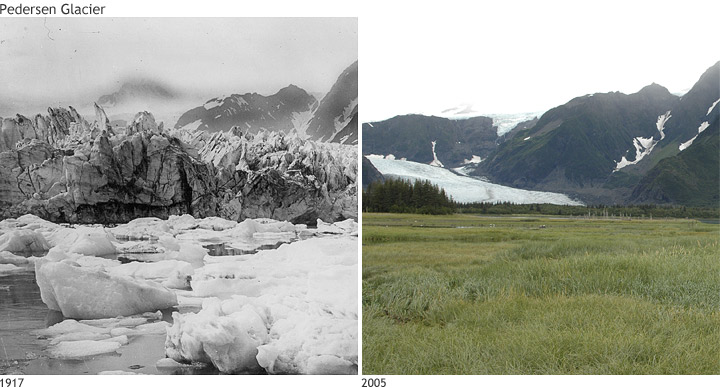
From the 1970s up through the last decade or so, melting and heat expansion were contributing roughly equally to observed sea-level rise. But the melting of mountain glaciers and ice sheets has accelerated:
- The decadal average loss from glaciers in the World Glacier Monitoring Service’s reference network quintupled over the past few decades, from the equivalent of 6.7 inches (171 millimeters) of liquid water in the 1980s, to 18 inches (460 millimeters) in the 1990s, to 20 inches (-500 millimeters) in the 2000s, to 33 inches (850 millimeters) for 2010-2018.
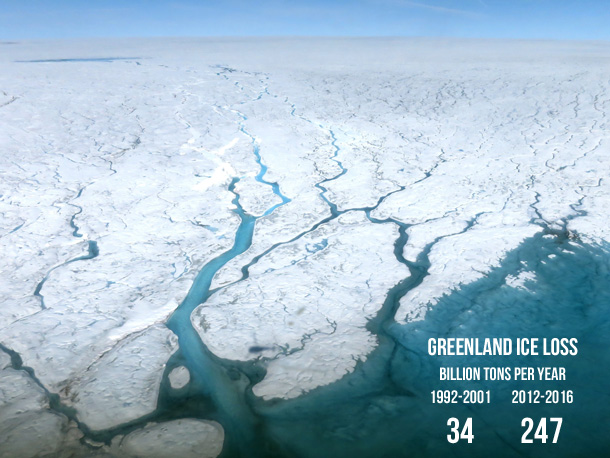
- Ice loss from the Greenland Ice Sheet increased seven-fold from 34 billion tons per year between 1992-2001 to 247 billion tons per year between 2012 and 2016.
- Antarctic ice loss nearly quadrupled from 51 billion tons per year between 1992 and 2001 to 199 billion tons per year from 2012-2016.
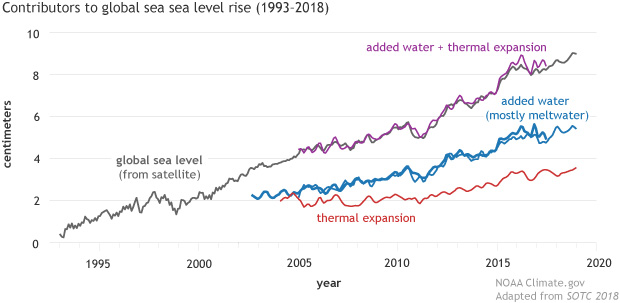
As a result, the amount of sea-level rise due to melting (with a small addition from groundwater transfer and other water storage shifts) from 2005–2013 was near twice the amount of sea-level rise due to thermal expansion.
The pace of global sea-level rise more than doubled from 1.4 mm per year throughout most of the twentieth century to 3.6 mm per year from 2006–2015.
Measuring sea level
Sea level is measured by two main methods: tide gauges and satellite altimeters. Tide gauge stations from around the world have measured the daily high and low tides for more than a century, using a variety of manual and automatic sensors. Using data from scores of stations around the world, scientists can calculate a global average and adjust it for seasonal differences.
Since the early 1990s, sea level has been measured from space using radar altimeters, which determine the height of the sea surface by measuring the return speed and intensity of a radar pulse directed at the ocean. The higher the sea level, the faster and stronger the return signal is.
To estimate how much of the observed sea-level rise is due to thermal expansion, scientists measure sea surface temperature using moored and drifting buoys, satellites, and water samples collected by ships. Temperatures in the upper half of the ocean are measured by a global fleet of aquatic robots. Deeper temperatures are measured by instruments lowered from oceanographic research ships.
To estimate how much of the increase in sea level is due to actual mass transfer—the movement of water from land to ocean—scientists rely on a combination of direct measurements of melt rate and glacier elevation made during field surveys, and satellite-based measurements of tiny shifts in Earth’s gravity field. When water shifts from land to ocean, the increase in mass increases the strength of gravity over oceans by a small amount. From these gravity shifts, scientists estimate the amount of added water.
Future sea-level rise
As global temperatures continue to warm, sea levels will continue to rise. How much it will rise depends mostly on the rate of future carbon dioxide emissions and future global warming. How fast it will rise depends mostly on the rate of glacier and ice sheet melting.
The pace of sea-level rise accelerated beginning in the 1990s, coinciding with acceleration in glacier and ice sheet melting. However, it’s uncertain whether that acceleration will continue, driving faster and faster sea-level rise, or whether internal glacier and ice sheet dynamics (not to mention natural climate variability) will lead to “pulses” of accelerated melting interrupted by slowdowns.
By the end of the century, global mean sea level is likely to rise at least one foot (0.3 meters) above 2000 levels, even if greenhouse gas emissions follow a relatively low pathway in the coming decades.
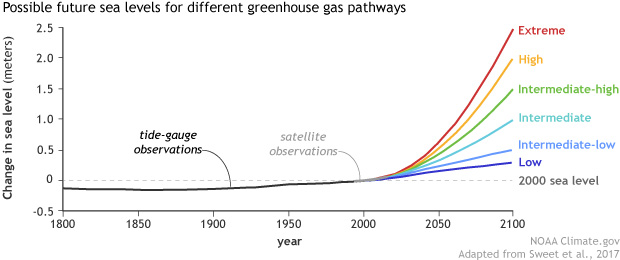
In 2012, at the request of the U.S. Climate Change Science Program, NOAA scientists conducted a review of the research on global sea-level rise projections. Their experts concluded that even with the lowest possible greenhouse gas emission pathways, global mean sea level would rise at least 8 inches (0.2 meters) above 1992 levels by 2100. With high rates of emissions, sea-level rise would be much higher but was unlikely to exceed 6.6 feet higher than 1992 levels.
Both the low-end and “worst-case” possibilities were revised upward in 2017 following a review by the U.S. Interagency Sea Level Rise Taskforce. Based on their new scenarios, global sea level is very likely to rise at least 12 inches (0.3 meters) above 2000 levels by 2100 even on a low-emissions pathway. On future pathways with the highest greenhouse gas emissions, sea-level rise could be as high as 8.2 feet (2.5 meters) above 2000 levels by 2100.
The higher worst-case scenario—which is extremely unlikely, but can’t be ruled out—is largely due to new observations and modeling on ice loss from Antarctica and Greenland. Since the 2012 report, new research has emerged showing that some of the more extreme estimates of how quickly those ice sheets could melt were more plausible than they previously seemed.
Along almost all U.S. coasts outside Alaska, the 2017 projections indicate that sea-level rise is likely to be higher than the global average for the three highest sea-level rise pathways, thanks to local factors like land subsidence, changes in ocean currents, and regional ocean warming. For the densely populated Atlantic seaboard north of Virginia and the western Gulf of Mexico, sea-level rise will likely be higher than the global average for all pathways. On the bright side, if future energy choices keep us on one the three lowest pathways, Alaska and the Pacific Northwest are likely to experience local sea-level rise that is less than the global average.
In all cases, however, rising sea levels are increasing coastal flood risk. High-tide flooding is already a serious problem in many coastal communities, and it is only expected to get much worse in the future with continued rising seas.
About the data used in the interactive graph
The early part of the time series shown in the graph above comes from the sea level group of CSIRO (Commonwealth Scientific and Industrial Research Organisation), Australia’s national science agency. The more recent part of the time series is from the University of Hawaii Sea Level Center. It is based on a weighted average of 373 global tide gauge records collected by the U.S. National Ocean Service, UHSLC, and partner agencies worldwide. The weights for each gauge in the global mean are determined by a cluster analysis that groups gauges from locations where sea level tends to vary in the same way. This prevents over-emphasizing regions where there are many tide gauges located in close proximity. The values are shown as a change in sea level in millimeters compared to the 1993-2008 average.
One other thing to remember is that if anyone bothers to look in to deep history, it’s obvious that sea levels have constantly risen and fallen without any human involvement, just as they might be, and I stress might be, depending on which data you choose to believe, today. Populations have migrated as these changes have occurred, as proven by archeological digs around the world. If sea levels are in fact rising, it wouldn’t be anything new. A number of supposedly ‘endangered’ islands have experienced growth during a supposedly deadly sea level rise, and this, too, has happened throughout history. And as for the ‘sky is falling’ scenario, you’ll note that the Obamas bought a waterfront estate on the east coast, and other prominent ‘climate change’ proponents have done the same or are already living on or near beaches. It’s possible that sea levels are rising, and I’m fine with that, if the facts bear it out. I just haven’t seen a coherent body of facts that lead me to believe it.
The data is the data, regardless of its source. The Institute is as credible as any of the sources cited at the end of the article.
This is an interesting and pretty factual response to the above article:
https://climateataglance.com/climate-at-a-glance-sea-level-rise/
Dave, that link is to a website run by the Heartland Institute.
They are NOT a credible source when it comes to climate change, or most topics for that matter.
Their track record speaks for itself…