This article first appeared on climate.gov and was written by LuAnn Dahlman and Rebecca Lindsey on August 17, 2020
Rising amounts of greenhouse gases are preventing heat radiated from Earth’s surface from escaping into space as freely as it used to. Most of the excess atmospheric heat is passed back to the ocean. As a result, upper ocean heat content has increased significantly over the past few decades.
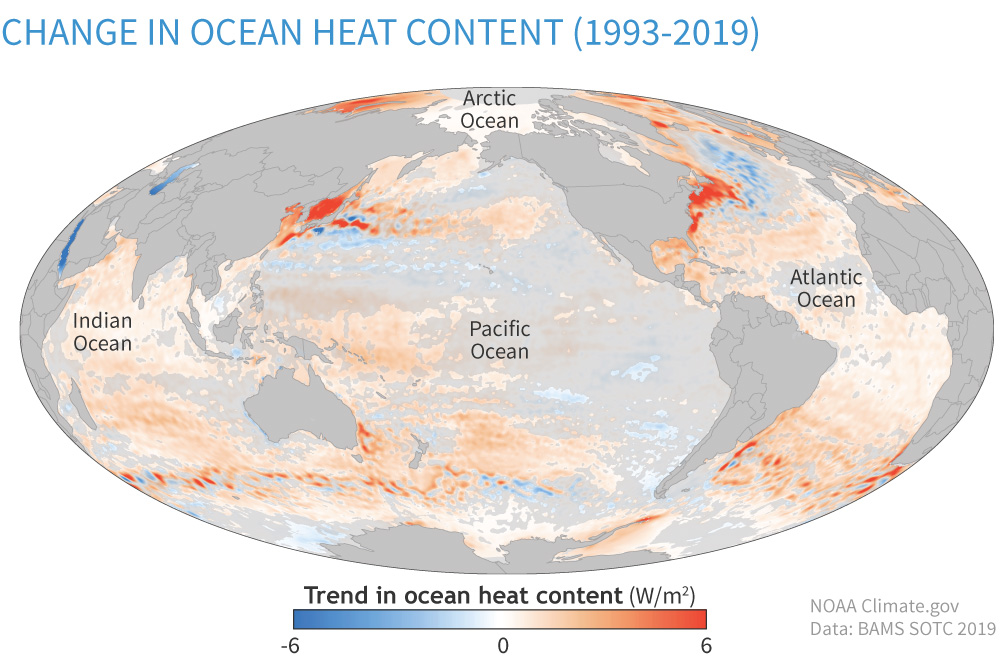
Averaged over Earth’s surface, the 1993–2019 heat-gain rates were 0.36 (±0.06) to 0.41 (±0.04) watts per square meter for depths from 0–700 meters and 0.14 (±0.04) to 0.32 (±0.03) for depths of 700–2,000 meters. For depths between 2000–6000 m, the estimated increase was 0.06 (±0.03) watts per square meter for the period from June 1992 to July 2011. According to the State of the Climate 2019 report, “Summing the three layers (with their slightly different time periods), the full-depth ocean heat gain for the period from approximately 1993 to 2019 ranges from 0.55 to 0.79 watts per square meter.”
How heat moves
The ocean is the largest solar energy collector on Earth. Not only does water cover more than 70 percent of our planet’s surface, it can also absorb large amounts of heat without a large increase in temperature. This tremendous ability to store and release heat over long periods of time gives the ocean a central role in stabilizing Earth’s climate system. The main source of ocean heat is sunlight. Additionally, clouds, water vapor, and greenhouse gases emit heat that they have absorbed, and some of that heat energy enters the ocean. Waves, tides, and currents constantly mix the ocean, moving heat from warmer to cooler latitudes and to deeper levels.
Heat absorbed by the ocean is moved from one place to another, but it doesn’t disappear. The heat energy eventually re-enters the rest of the Earth system by melting ice shelves, evaporating water, or directly reheating the atmosphere. Thus, heat energy in the ocean can warm the planet for decades after it was absorbed. If the ocean absorbs more heat than it releases, its heat content increases. Knowing how much heat energy the ocean absorbs and releases is essential for understanding and modeling global climate.
Measuring ocean heat
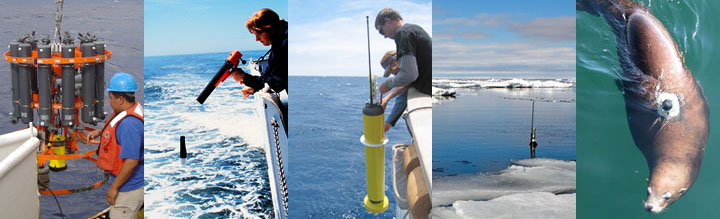
Historically, taking the ocean’s temperature required ships to dangle sensors or sample collectors into the water. This time-consuming method could only provide temperatures for a small part of the planet’s vast ocean. To get global coverage, scientists turned to satellites that measure the height of the ocean’s surface. As water warms, it expands, so estimates for ocean temperature can be deduced from sea surface heights.
To get a more complete picture of ocean heat content at different depths, scientists and engineers also use a range of in situ temperature-sensing instruments. Among these are a fleet of more than 3,000 robotic “floats” that measure ocean temperature around the world. Known as Argo floats, the sensors drift through the ocean at different depths. Every 10 days or so, according to their programmed instructions, they rise through the water, recording temperature (and salinity) as they ascend. When a float reaches the surface, it sends its location and other information to scientists via satellite and then descends again.
Scientists constantly compare data from satellites, floats, and probes to verify that the values they produce make sense. They process the range of measurements to calculate an estimate for global average ocean heat content every three months. Converting the temperatures to joules (a standard unit of energy) allows them to compare heat in the ocean to heat in other parts of Earth’s climate system.
Change over time
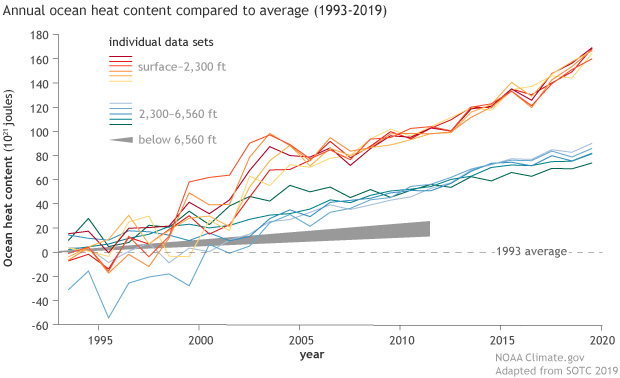
More than 90 percent of the warming that has happened on Earth over the past 50 years has occurred in the ocean. Recent studies estimate that warming of the upper oceans accounts for about 63 percent of the total increase in the amount of stored heat in the climate system from 1971 to 2010, and warming from 700 meters down to the ocean floor adds about another 30 percent.
Less than a watt per square meter might seem like a small change, but multiplied by the surface area of the ocean (more than 360 million square kilometers), that translates into an enormous global energy imbalance. It means that while the atmosphere has been spared from the full extent of global warming for now, heat already stored in the ocean will eventually be released, committing Earth to additional warming in the future.
In the present, the warming of ocean water is raising the global sea level because water expands when it warms. Combined with water from melting glaciers on land, the rising sea threatens natural ecosystems and human structures near coastlines around the world. Warming ocean waters are also implicated in the thinning of ice shelves and sea ice, both of which have further consequences for Earth’s climate system. Finally, warming ocean waters threaten marine ecosystems and human livelihoods. For example, warm waters jeopardize the health of corals, and in turn, the communities of marine life that depend upon them for shelter and food. Ultimately, people who depend upon marine fisheries for food and jobs may face negative impacts from the warming ocean.
Information on how ocean heat content is calculated from ocean temperatures is available from NOAA’s National Oceanographic Data Center.