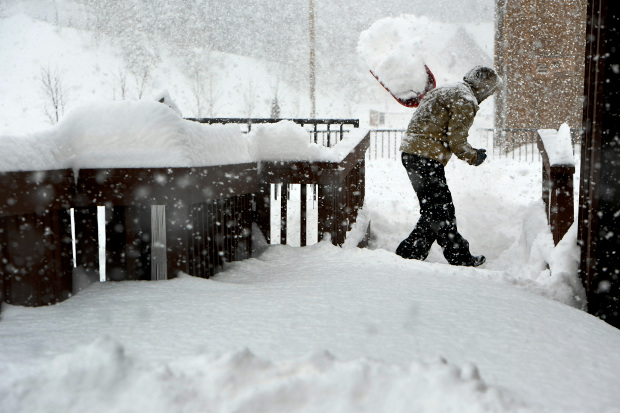
Over the weekend, central and eastern Colorado was hammered with a massive winter storm. The storm became the 4th strongest storm of all time in Denver, to the surprise of many. Now that the storm is finally over let’s look at what happened with the storm and why the forecasts over and under forecasted some of the totals.
This storm has been weeks in the making. The surface low formed over the northern Pacific around Saturday, March 6th. Two conflicting temperature fronts collided, causing cyclogenesis. The storm continued to intensify as it moved down the Pacific coast.
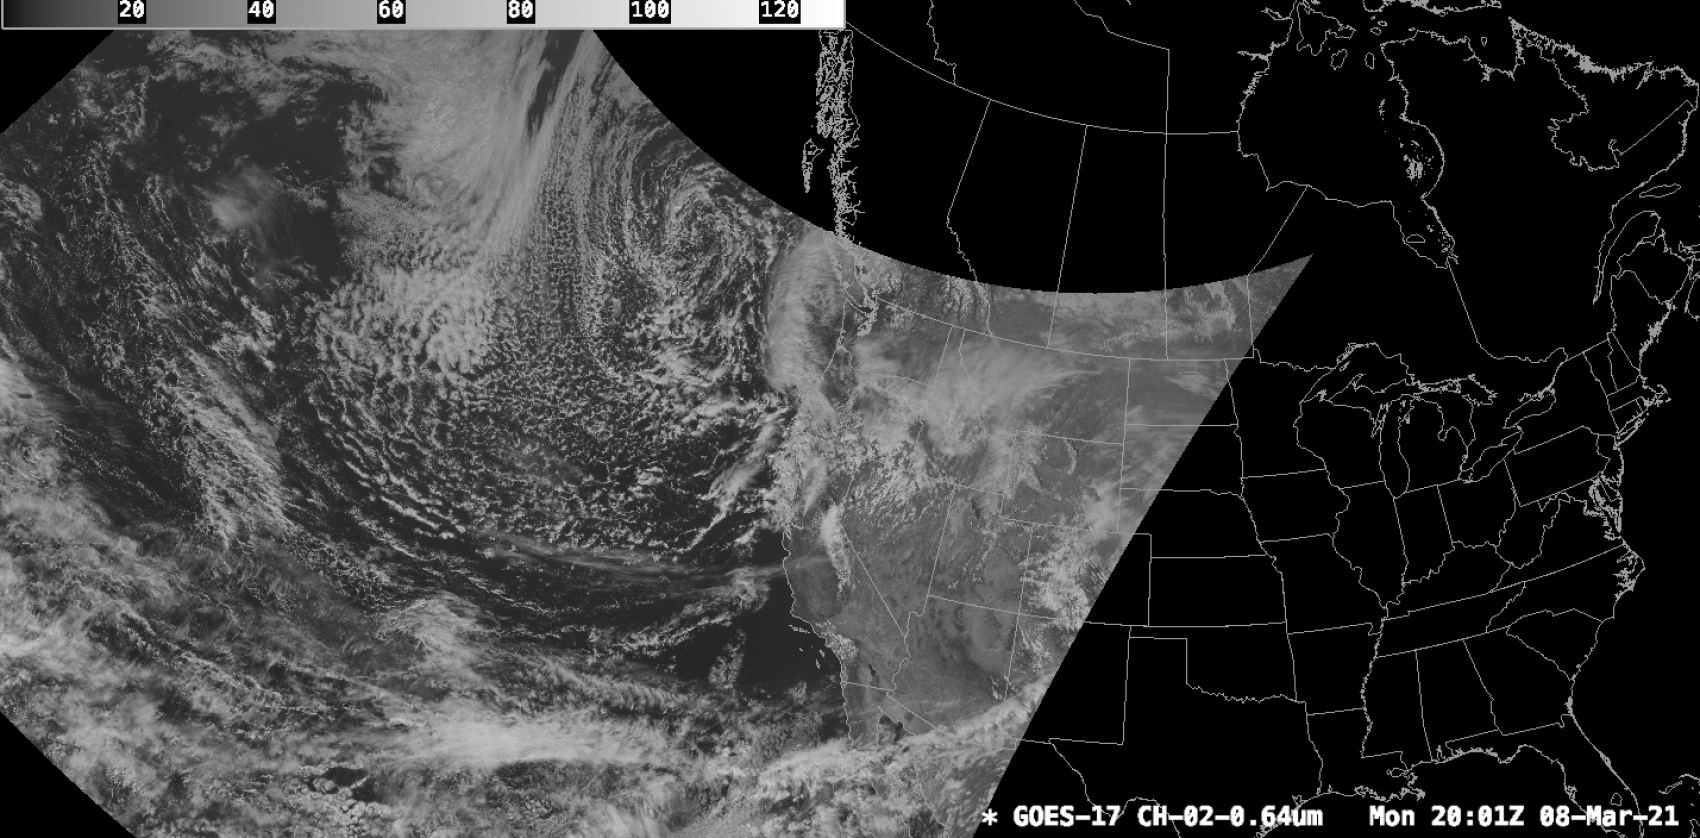
The storm track turned eastward on the 9th and carried nice energy into northern California, dropping several inches of snow.
From that point on, the storm continued to make a slow but steady march towards Colorado. The storm had now separated from the jet stream, forming something known as a cutoff low. Much of the moisture had been sucked out by the Sierra Nevada mountains through snowfall on the night of the 9th, and limited snow and rain accumulations were experienced in the Southwest US. However, a plume of moisture propelled from the Pacific near the equator fueled the storm and provided the necessary moisture to continue into Colorado as a strong mid-latitude cyclone.
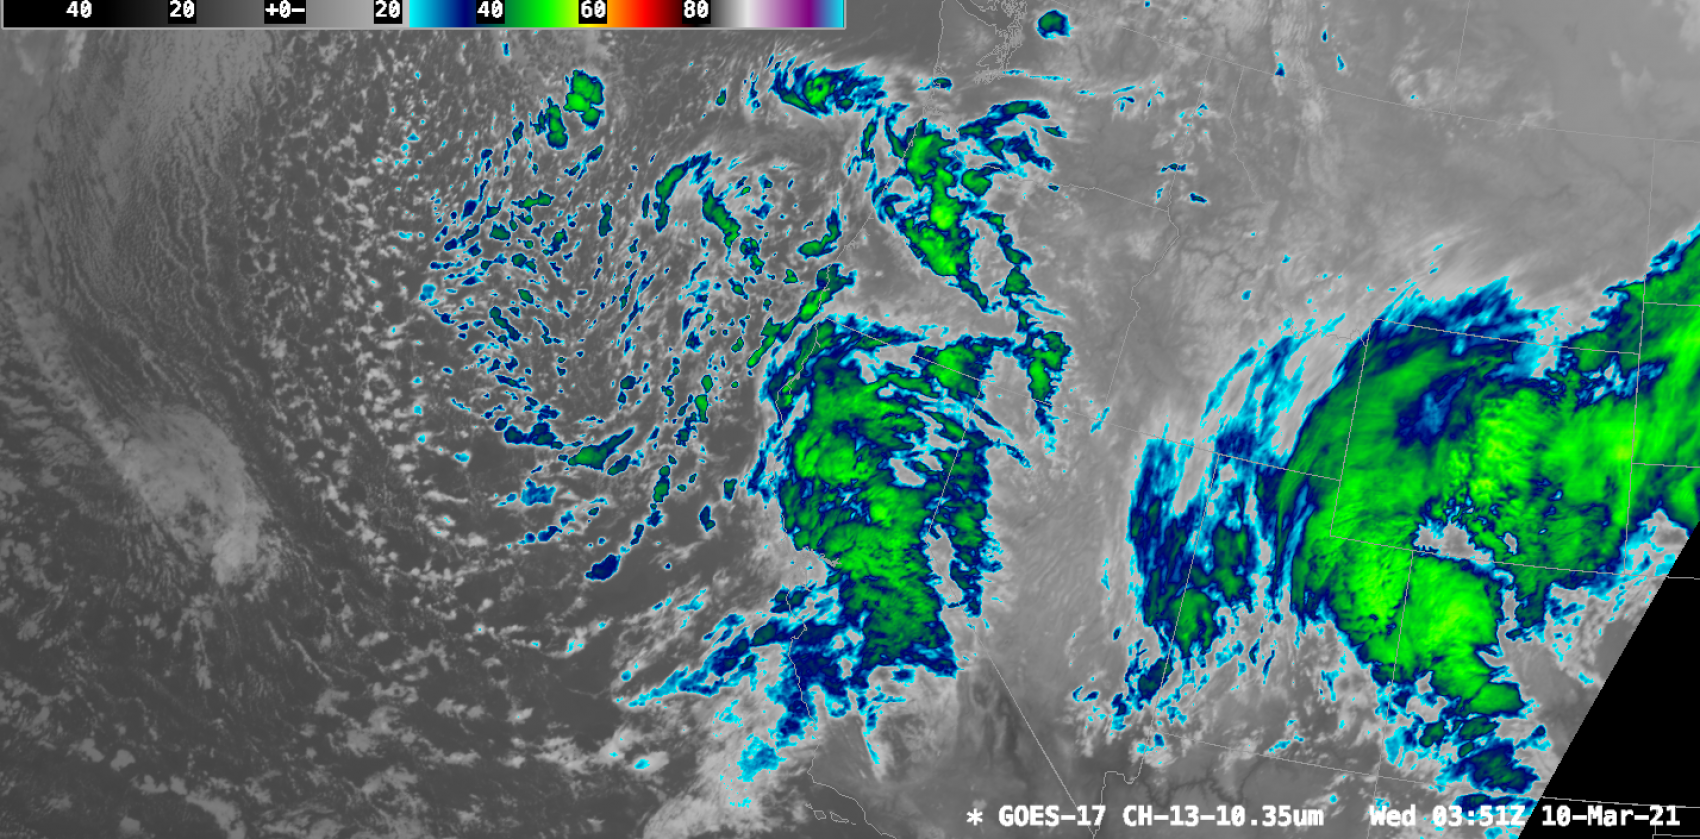
As the storm progressed east, it engulfed said moisture from the Pacific. When the colder arm of the cyclone caught up to the warm, moist air, it impeded to the east under the humid air mass, lifting it into the atmosphere and causing intense precipitation over northern Texas, Oklahoma, Nebraska, and South Dakota, but more importantly, saturating the air to 100% RH.

The low pressure at the center of the storm caused said moisture to flow to the northern area of the storm, which sat right over Fort Collins, Boulder, and Denver. The intense moisture combined with moderate convection over the plains and I-25 corridor forced intense snowfall. Additionally, the Front Range foothills got a boost in snowfall due to upslope flow, which cools the air at a rapid pace and causes moisture to condense, eventually falling as snow.
The video below shows cloud top temperature as the storm progressed. In general, the colder these temperatures are, the stronger convection is present. The stronger the convection within a storm is, typically, the stronger the storm is. You can see below that the primary driver of precipitation east of the Rockies, including Denver and Boulder, was convective energy condensing the moist air as it moved vertically.
These are the primary factors the motivated the remarkable snowfall event in eastern Colorado from March 13-14, 2021. The video below is a replay of the whole storm in its beautiful entirety on the GOES-16 ABI-13 clear window infrared band.
However, many forecasts, including my own, were calling for more snow. So what happened? Let’s take a look.
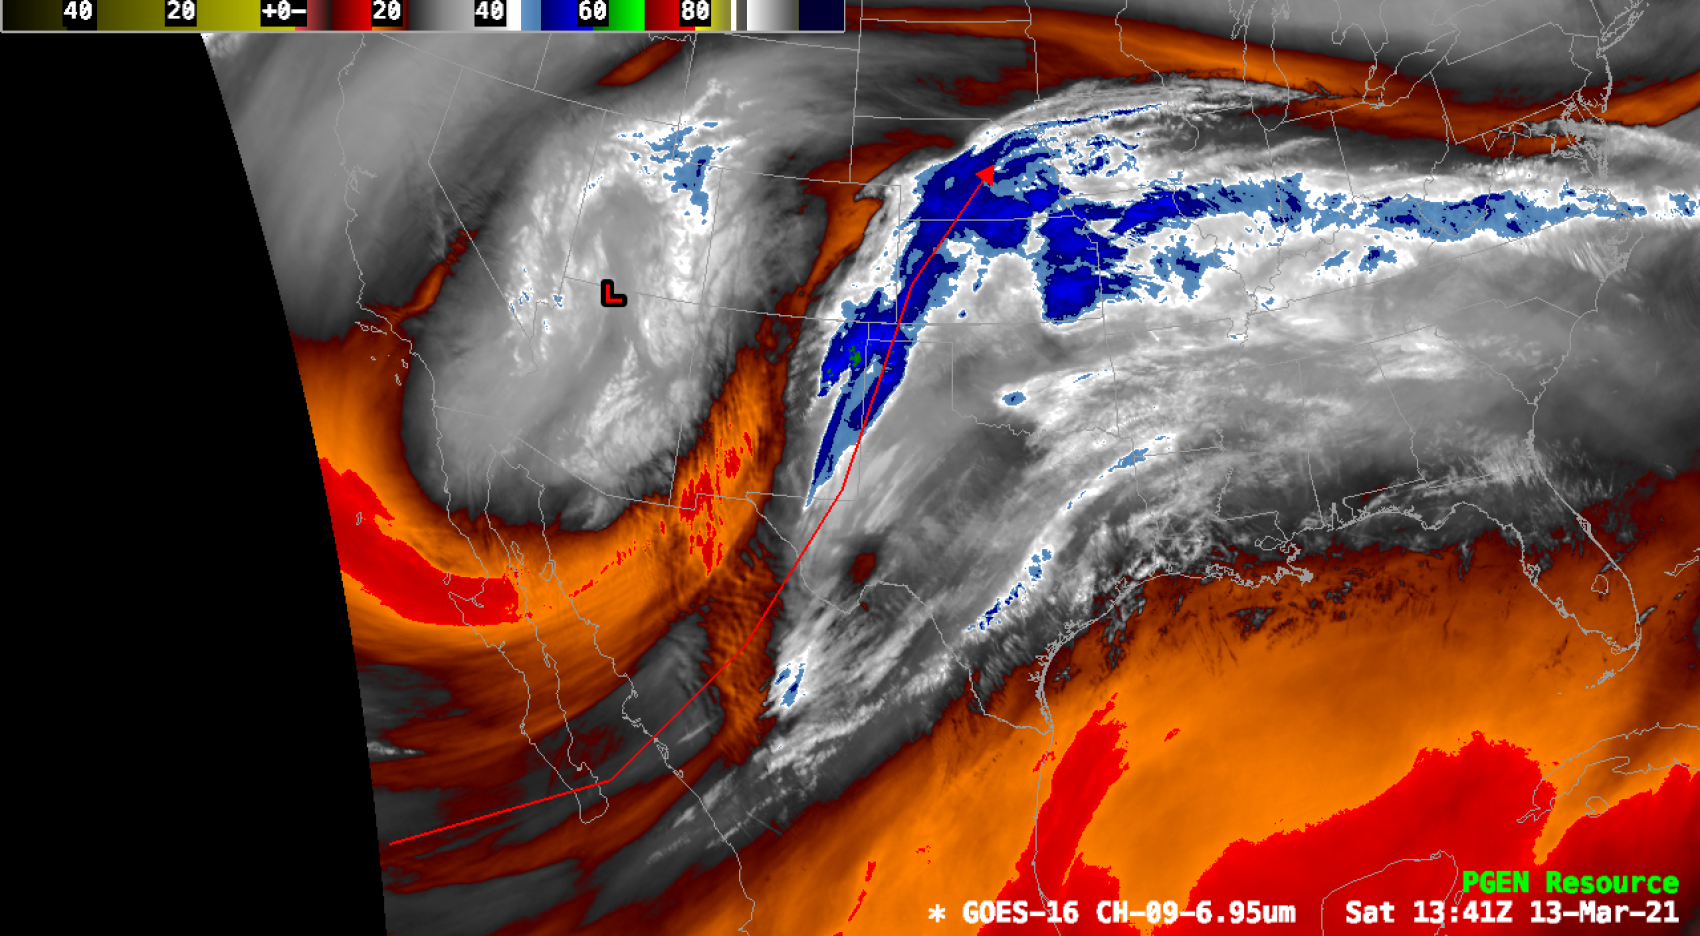
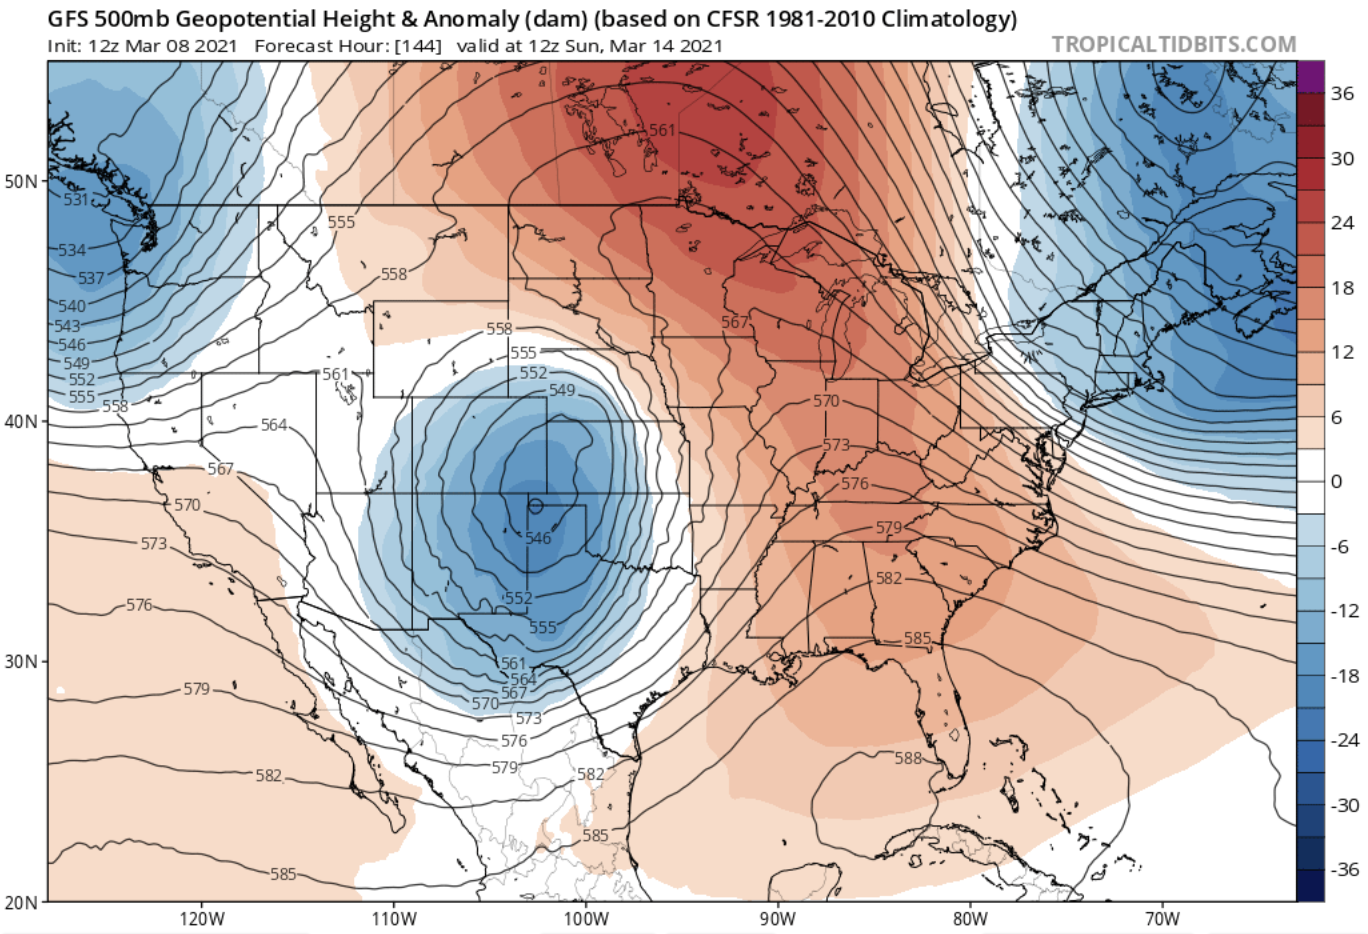
The thing that immediately caught my eye was that the storm energy center was further to the north than forecasted. Below is an image from a GFS 500Mb geopotential height forecast from March 8:
And now, here’s a satellite photo of the actual system at 12z UTC on March 14:
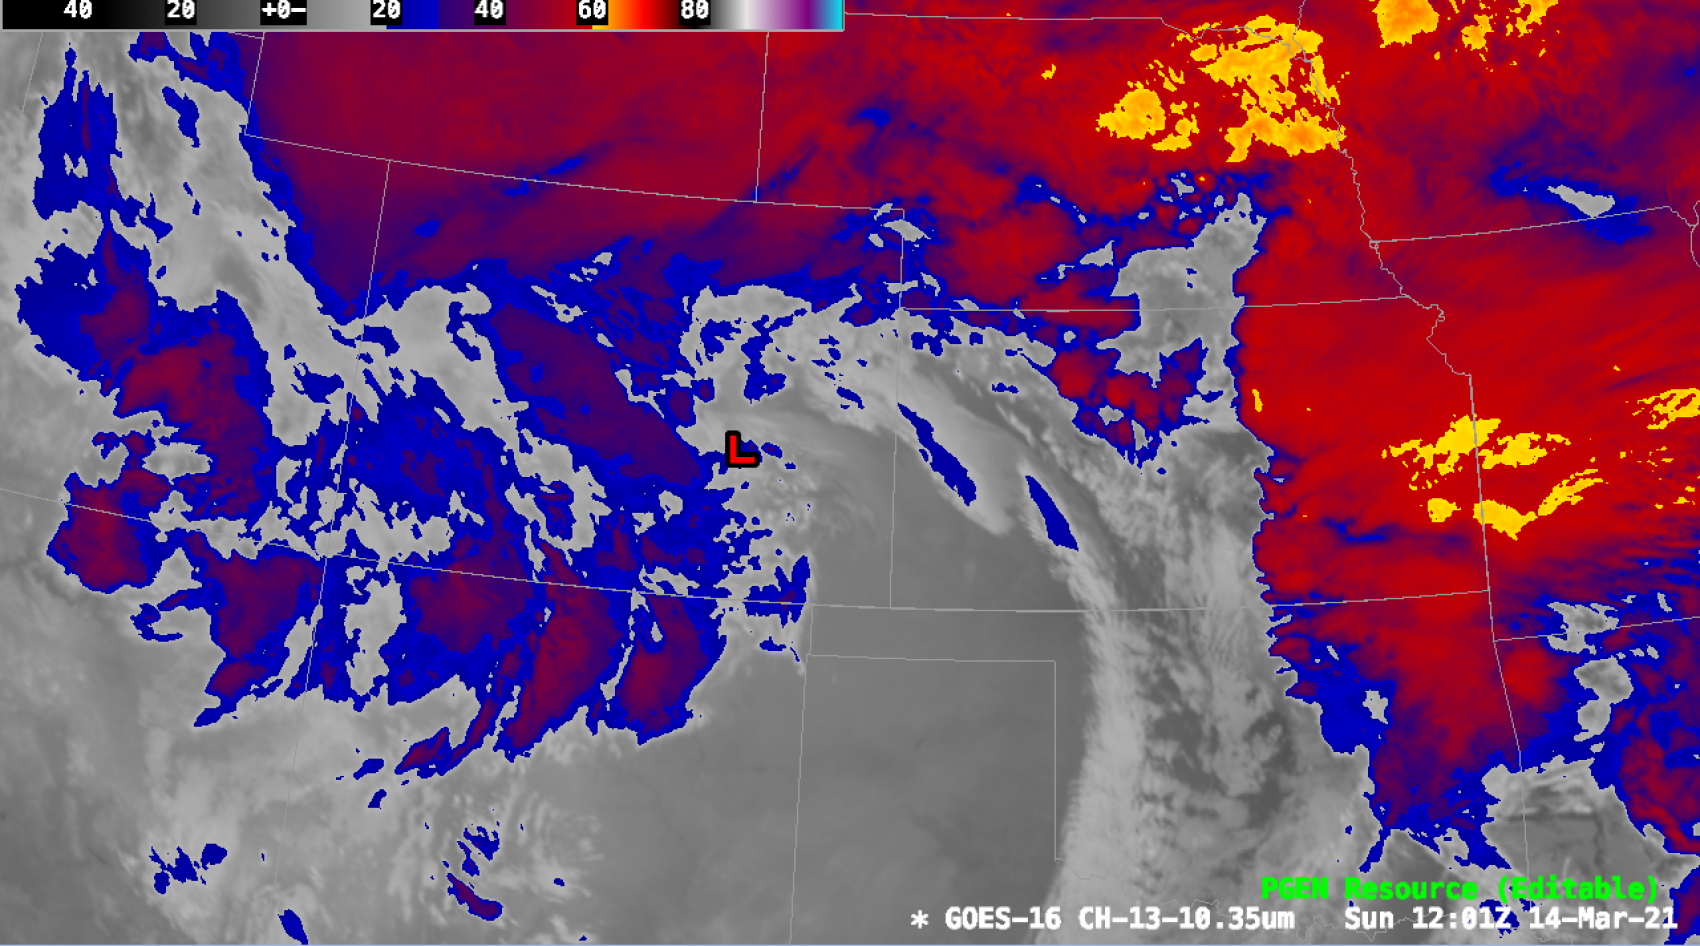
As you can see, the low pressure is quite a bit further north than was forecasted. This impacted Boulder significantly. Rather than having a due east flow that would absolutely hammer it with moisture, Boulder actually got winds and snow from the north, which is a less aggressive direction for it to get hammered. This is because as the center of the storm shifted to the north, so did the northern boundary with the east flow, completely missing Boulder. The result was a north-south boundary jet on the western edge of the storm, flowing along the Rockies’ eastern foothills, which did not deliver as much moisture for Boulder as the models called for. The same goes for Estes Park, which only received about half of what it was forecasted to get!
Denver, however, did not do as poorly from the changed pressure location. Denver was forecasted to be right on the northern edge of the center of the low, so the shift in location did not affect forecast / actual ratios the way that it did for Boulder and Estes Park.
Additionally, another thing that knocked Boulder’s snow totals down was the snow ratio. I forecasted an 8:1 snow/liquid ratio for Boulder; however, that ratio ended up being closer to about 6.5 with all things considered. The storm came in much warmer than expected, which generated lower snow totals.
Overall, this storm was very exciting to watch. In my forecast post last Thursday, I mentioned that this storm would be chaotic and hard to forecast, which was certainly the case.