This post first appeared on the climate.gov ENSO blog and was written by Nat Johnson
As the 2020–21 La Niña has come to an end, leaving us with neutral conditions in the tropical Pacific, we now wonder if we have seen the last of La Niña for a while or if we will see another dip into La Niña conditions by next fall. In the world of the El Niño-Southern Oscillation (ENSO), double-dipping is not a party foul—it’s actually quite common for La Niña to occur in consecutive winters (not El Niño, though). If you’re wondering why then this is the blog post for you!
Mirror, mirror on the wall
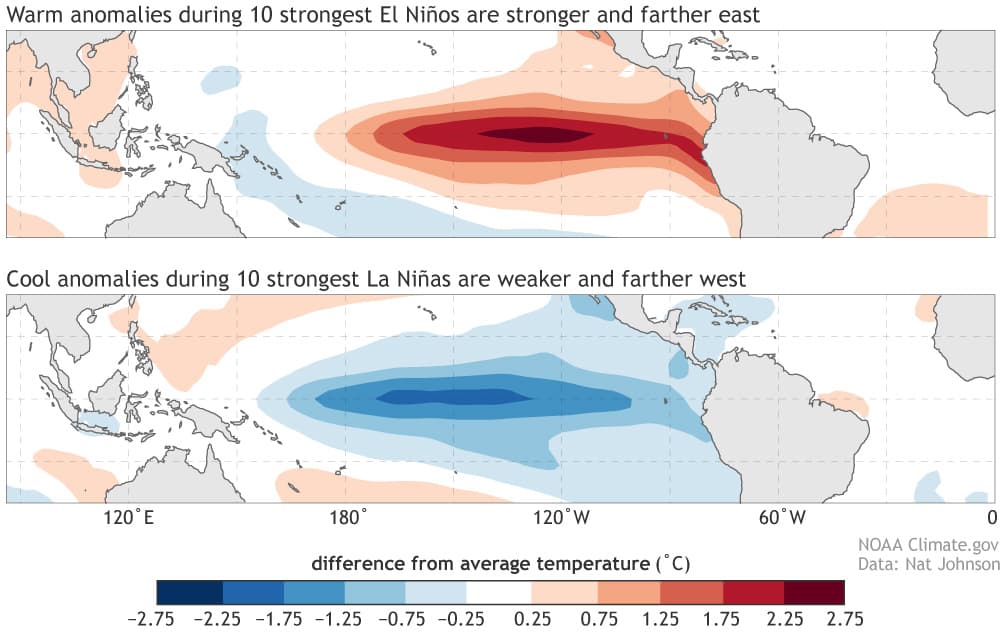
To understand why La Niña commonly double dips, we first need some basic understanding of ENSO asymmetry. Often, we think of El Niño and La Niña as mirror opposites—for example, that the warmer-than-average east-central tropical Pacific conditions during El Niño are exactly matched by the cooler-than-average conditions of La Niña. This mirror-opposites perspective is a pretty good approximation, but it’s not perfect!
Upon closer inspection, we see some subtle but important differences between El Niño and La Niña in terms of their patterns and behavior. First, the sea surface temperature anomalies (difference from the long-term average) during El Niño tend to be centered farther east than for La Niña, especially for the stronger El Niño episodes. Second, the strongest El Niños tend to be stronger than the strongest La Niñas. We can see these differences in the maps above. The warm anomalies in the eastern Pacific for the El Niño composite are between 2.25 and 2.75 degrees Celsius (4 and 5 degrees Fahrenheit), while the cool anomalies in the east-central Pacific for the La Niña composite top out at 2.25 degrees C.
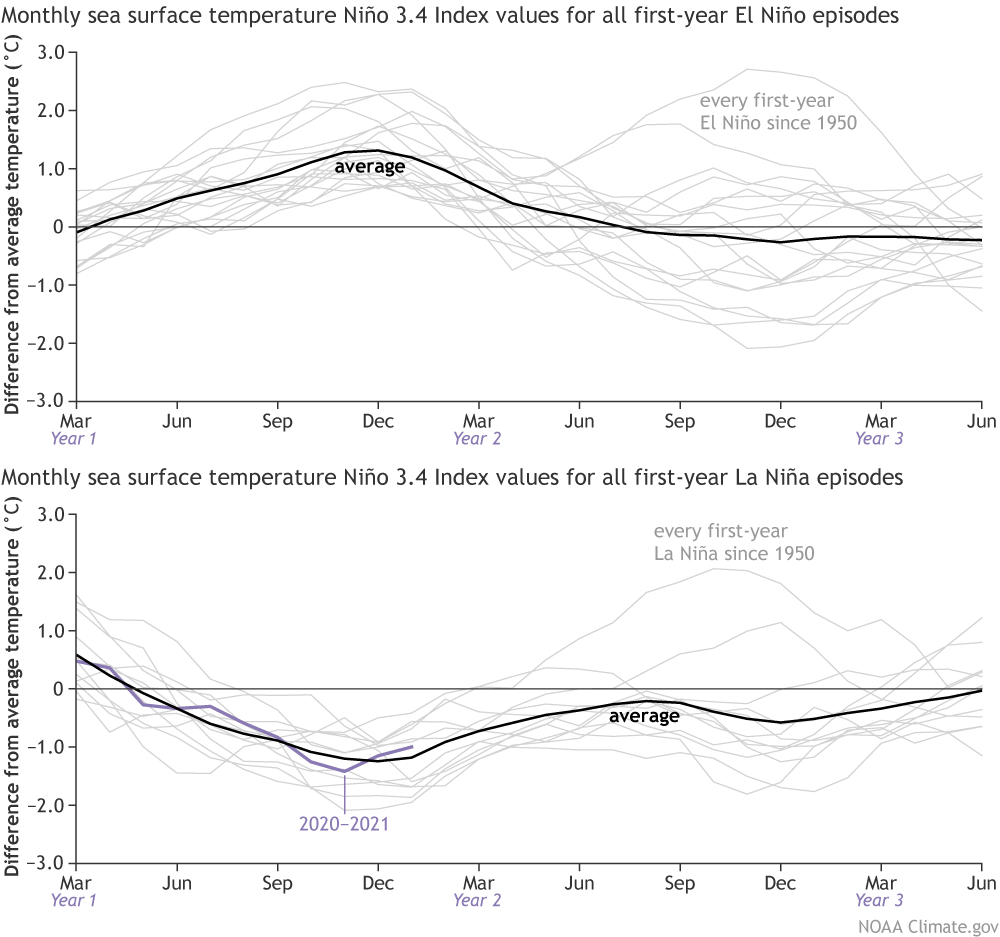
We also see notable differences in how sea surface temperatures in the Niño 3.4 region of the Pacific change over time for first-year El Niños (meaning, the previous winter did not feature El Niño) and first-year La Niñas. After the peak of El Niño, which typically occurs in late fall or winter, Niño3.4 surface temperatures usually decline rapidly to neutral conditions by the following spring. In the ensuing summer through winter, ENSO neutral conditions continue, or La Nina develops, but the occurrence of El Niño in a second consecutive winter is uncommon.
For La Niña, in contrast, the return to ENSO neutral after the late fall peak is usually more gradual, and, as Emily recently reminded us, the transition to El Niño after the first winter of La Niña rarely occurs. Instead, we generally see ENSO-neutral or a transition back into La Niña conditions by the following fall, as shown by that second dip in average Niño3.4 temperatures in the plot above. To reiterate what Emily already noted, of the 12 first-year La Niña events on record, 8 were followed by La Niña the next winter, 2 by neutral, and 2 by El Niño.
All things being unequal
Things would be simpler if El Niño and La Niña behaved similarly, so why are the transitions out of El Niño and La Niña so different? The answers lie in the processes that cause El Niño and La Niña to strengthen and weaken. Several months ago, Michelle introduced us to the essential processes for ENSO, the fun-to-say Bjerknes feedbacks. Essentially, Bjerknes feedbacks describe the reinforcing interactions (positive feedbacks) between the ocean and atmosphere that cause El Niño and La Niña to grow: changes in the tropical Pacific ocean temperatures cause changes in the overlying trade winds, which then cause additional, reinforcing changes in the ocean temperature (please see Michelle’s post for more of the details!).
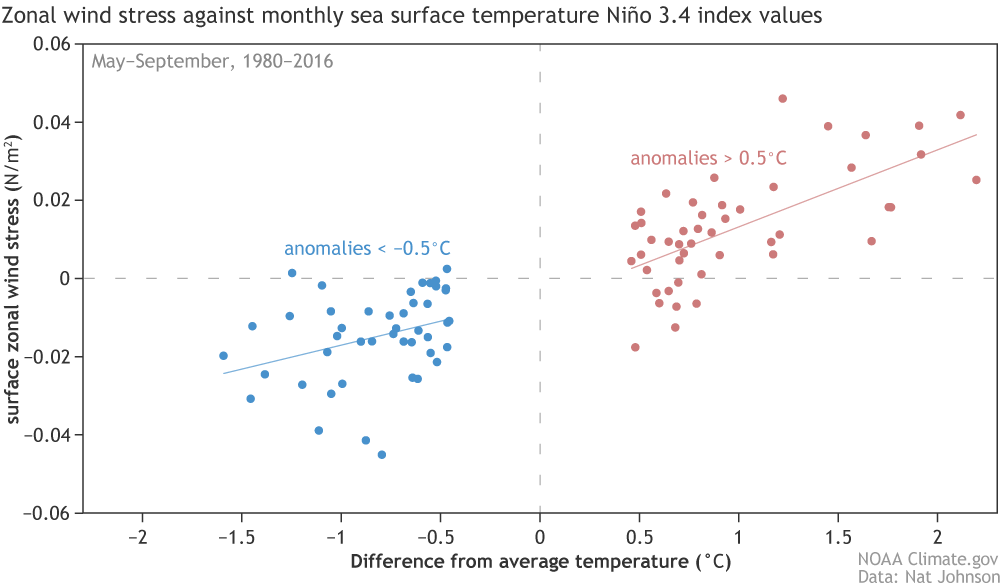
If all essential processes that comprise this feedback process were equal but opposite for El Niño and La Niña, then we might expect mirror opposite patterns. However, this isn’t the case. For example, the response of the trade winds to the Niño3.4 surface temperatures is unequal between warmer and cooler surface conditions. We see this above in the scatter plot of monthly May–September zonal (east-west direction) wind stress anomalies (1) in the equatorial Pacific versus the Niño3.4 surface temperature anomalies. As we expect, warmer Niño3.4 surface temperatures that are tied to El Niño conditions bring weaker trade winds and a weaker Walker circulation (positive wind stress anomalies), whereas cooler Niño3.4 conditions bring stronger trade winds (negative wind stress anomalies) connected with a stronger Walker circulation.
However, the plot also reveals that the relationship between the warm (El Niño) and cool (La Niña) sea surface temperature anomalies and the wind anomalies they generate are not equal. El Niño’s warm water anomalies generally produce wind stress anomalies that are stronger and farther east than those produced by cool La Niña anomalies of equal strength. The stronger response is demonstrated by the steeper slope of the red line versus the blue line. This difference may seem a bit subtle, but it can have big consequences for ENSO asymmetry (2).
The strength of the coupling between the winds and the upper ocean matters because it not only strengthens El Niño and La Niña, but it also sets the wheels in motion for the ultimate demise of each event. The strong coupling between ocean and atmosphere and the more eastward wind stress anomalies during El Niño contributes to a robust poleward discharge of equatorial Pacific upper-ocean heat, typically by early spring, that ends the El Niño event and sets the stage for the next La Niña. The weaker coupling and more westward wind stress anomalies during La Niña mean that the corresponding “recharge” of heat is also weaker, and so the ocean is not as primed for a transition to El Niño. Instead, if we experience the right sequence of tropical weather, the second winter of La Niña may return instead (3).
The scenario I have described is far from complete, as there are many other atmospheric and oceanic (and even biological!) processes that likely contribute to ENSO asymmetry and the tendency for La Niña to persist for more than one winter (4). There is still considerable debate about which processes are most important for these El Niño/La Niña differences (still so much unsettled ENSO science!).
A heads up?
Can we predict when La Niña will double-dip? Some recent studies suggest that we may be able to predict (in a probabilistic sense) more than a year in advance the likelihood of two-year La Niña based on the strength of the preceding El Niño and poleward discharge of equatorial heat (5). However, the most recent La Niña is a bit unusual because El Niño did not immediately precede it, and so it is difficult to identify any clear indicators that La Niña will return next fall at this time. Although we must await further guidance to get a better handle on the forecast, we at least can say that both history and the current ENSO forecast suggest that El Niño is unlikely to return in the near future.
Special thanks to Dr. Andrew Wittenberg for guidance and helpful comments while preparing this blog post!
Footnotes
(1) Wind stress measures the lateral force per unit area that the wind exerts on the ocean surface. A “positive zonal wind stress anomaly” corresponds to an anomalous eastward force on the ocean surface, exerted by a stronger-than-average eastward component of the winds; this weakens the normally westward force exerted by the trade winds. Conversely, negative zonal wind stress anomalies indicate a stronger westward force on the surface ocean, exerted by stronger-than-average westward trade winds.
(2) The zonal wind stress analysis of this post is modeled after Choi et al. (2013). That study provides conceptual and theoretical support for the hypothesis that the asymmetry in zonal wind stress response to tropical Pacific sea surface temperatures, like what is shown in the scatter plot of this post, is sufficient for explaining many of the asymmetries between El Niño and La Niña, including the tendency for La Niña to persist for more than one winter (see the next footnote for additional details).
Choi, K.-Y., G. A. Vecchi, and A. T. Wittenberg, 2013: ENSO transition, duration, and amplitude asymmetries: Role of the nonlinear wind stress coupling in a conceptual model. Journal of Climate, 36, 9462-9476. https://doi.org/10.1175/JCLI-D-13-00045.1
(3) For those of you who are interested in more of the scientific details about how this wind stress asymmetry between El Niño and La Niña may contribute to the tendency for La Niña to double-dip, this footnote provides additional, more technical discussion, courtesy of Dr. Andrew Wittenberg.
ENSO events are sparked by a disequilibrium between two coupled ocean/atmosphere time scales in the response to wind changes: a fast equatorial adjustment (oceanic equatorial Kelvin waves + Bjerknes feedbacks) and a slow off-equatorial adjustment (curl-induced oceanic Rossby waves and delayed negative feedbacks).
Equatorial wind anomalies that are located farther east (as during a strong El Niño) induce more transient growth, disequilibrium, and overshoot into the opposite phase for 2 key reasons. (1) Their resulting zonal current anomalies & upwelling anomalies are located closer to the warm pool edge in the central Pacific and shallow thermocline of the East Pacific. This strengthens the transient growth via fast equatorial processes (zonal advective feedback and Ekman feedback, two of the important Bjerknes feedbacks), which amps the wind anomalies so much that they can over-discharge the equatorial thermocline several months later. (2) When the off-equatorial wind stress curl anomalies are located farther east, they’re also farther from the western boundary, and so their resulting off-equatorial oceanic Rossby wave trains have farther/longer to travel before they can reflect back onto the equator and start the turnabout of the ENSO event. This enables the equatorial disequilibrium to grow more strongly before being impeded & eventually reversed by the delayed negative feedback. Thus, the more eastward-shifted zonal wind stress anomalies during strong El Niños enable stronger transient growth & disequilibrium, increasing the over-discharging and subsequent overshoot.
In short, under the “zonal wind stress asymmetry hypothesis” of Choi et al. (2013), La Niña is more likely to double-dip because its winds stress anomaly is so far from the “sea surface temperature-ticklish” zone of the central/eastern Pacific, and so close to the western boundary “transfer station” for the off-equatorial feedbacks, that La Niña just can’t get as much of a disequilibrium going – and hence can’t over-charge the equator enough to guarantee an overshoot into El Niño.
(4) For a comprehensive review of existing hypotheses for ENSO asymmetry, I recommend An et al. (2020).
An, S.-I., E. Tziperman, Y. Okumura, and T. Li, 2020: ENSO irregularity and asymmetry. In A. Santoso, M. McPhaden & W. Cai (Eds.), El Niño Southern Oscillation in a changing climate (pp. 153– 172). John Wiley & Sons.
(5) For example, a few recent studies, including two led by Dr. Pedro DiNezio, suggest that the probability of a multi-year La Niña may be skillfully predicted 18-24 months in advance, given a preceding El Niño. The sources of skill are rooted in the strength of the El Niño and the magnitude of poleward heat discharge 6 months after the peak of El Niño.
DiNezio, P. N., C. Deser, Y. M. Okumura, and A. Karspeck, 2017a: Predictability of 2-year La Niña events in a coupled general circulation model. Climate Dyn., 49, 4237–4261, https://doi.org/10.1007/S00382-017-3575-3.
DiNezio, P. N., C. Deser, A. Karspeck, S. Yeager, Y. Okumura, G. Danabasoglu, N. Rosenbloom, J. Caron, and G. A. Meehl, 2017b: A 2-year forecast for a 60–80% chance of La Niña in 2017–2018. Geophys. Res. Lett., 44, 11 624–11 635, https://doi.org/10.1002/2017GL074904.
Wu, X., Y. K. Okumura, C. Deser, and P. N. DiNezio, 2021: Two-year dynamical predictions of ENSO event duration during 1954–2015. J. Climate, 34, 4069-4087, https://doi.org/10.1175/JCLI-D-20-0619.1.