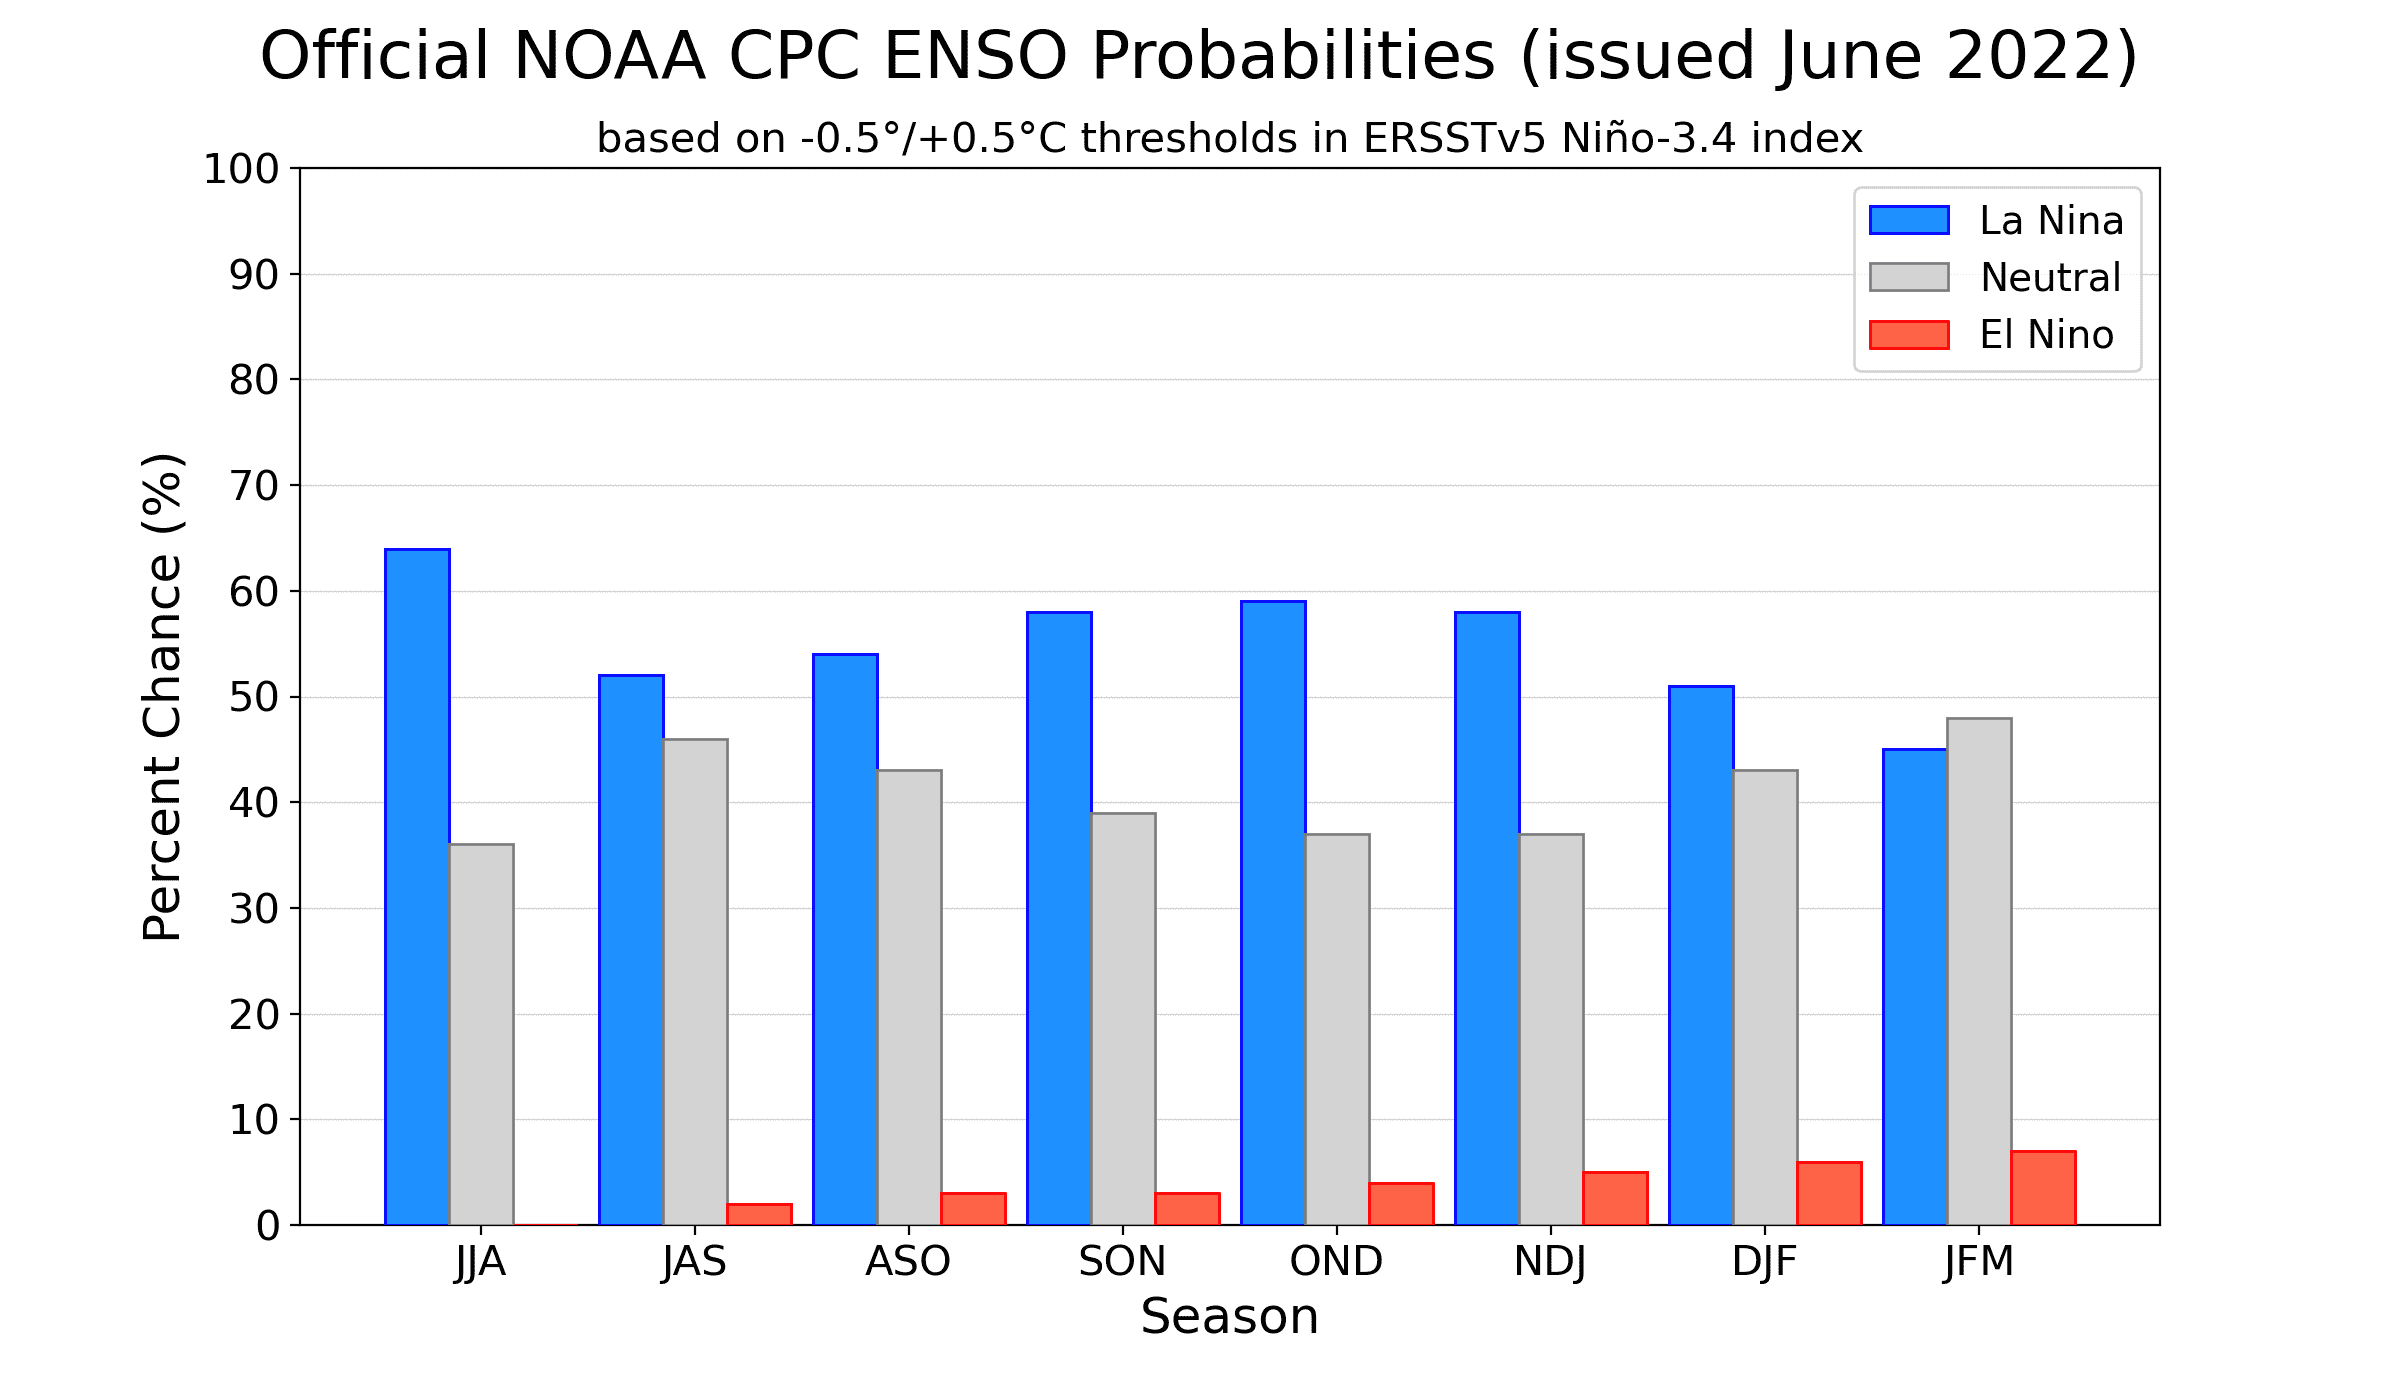
I’m definitely starting to sound like a broken record here! La Niña is favored to continue through the summer and into the winter. That said, chances of La Niña through summer have a fairly small edge over chances of a transition to neutral—52% for La Niña vs. 46% for neutral in July–September. There’s about a 59% chance of La Niña by early winter.
Dig deep
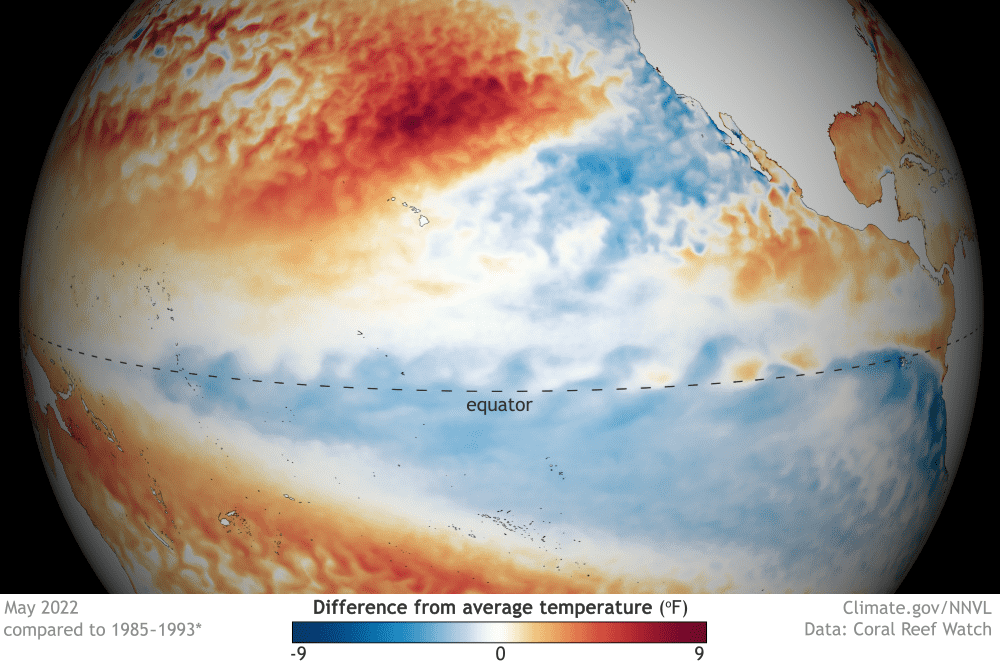
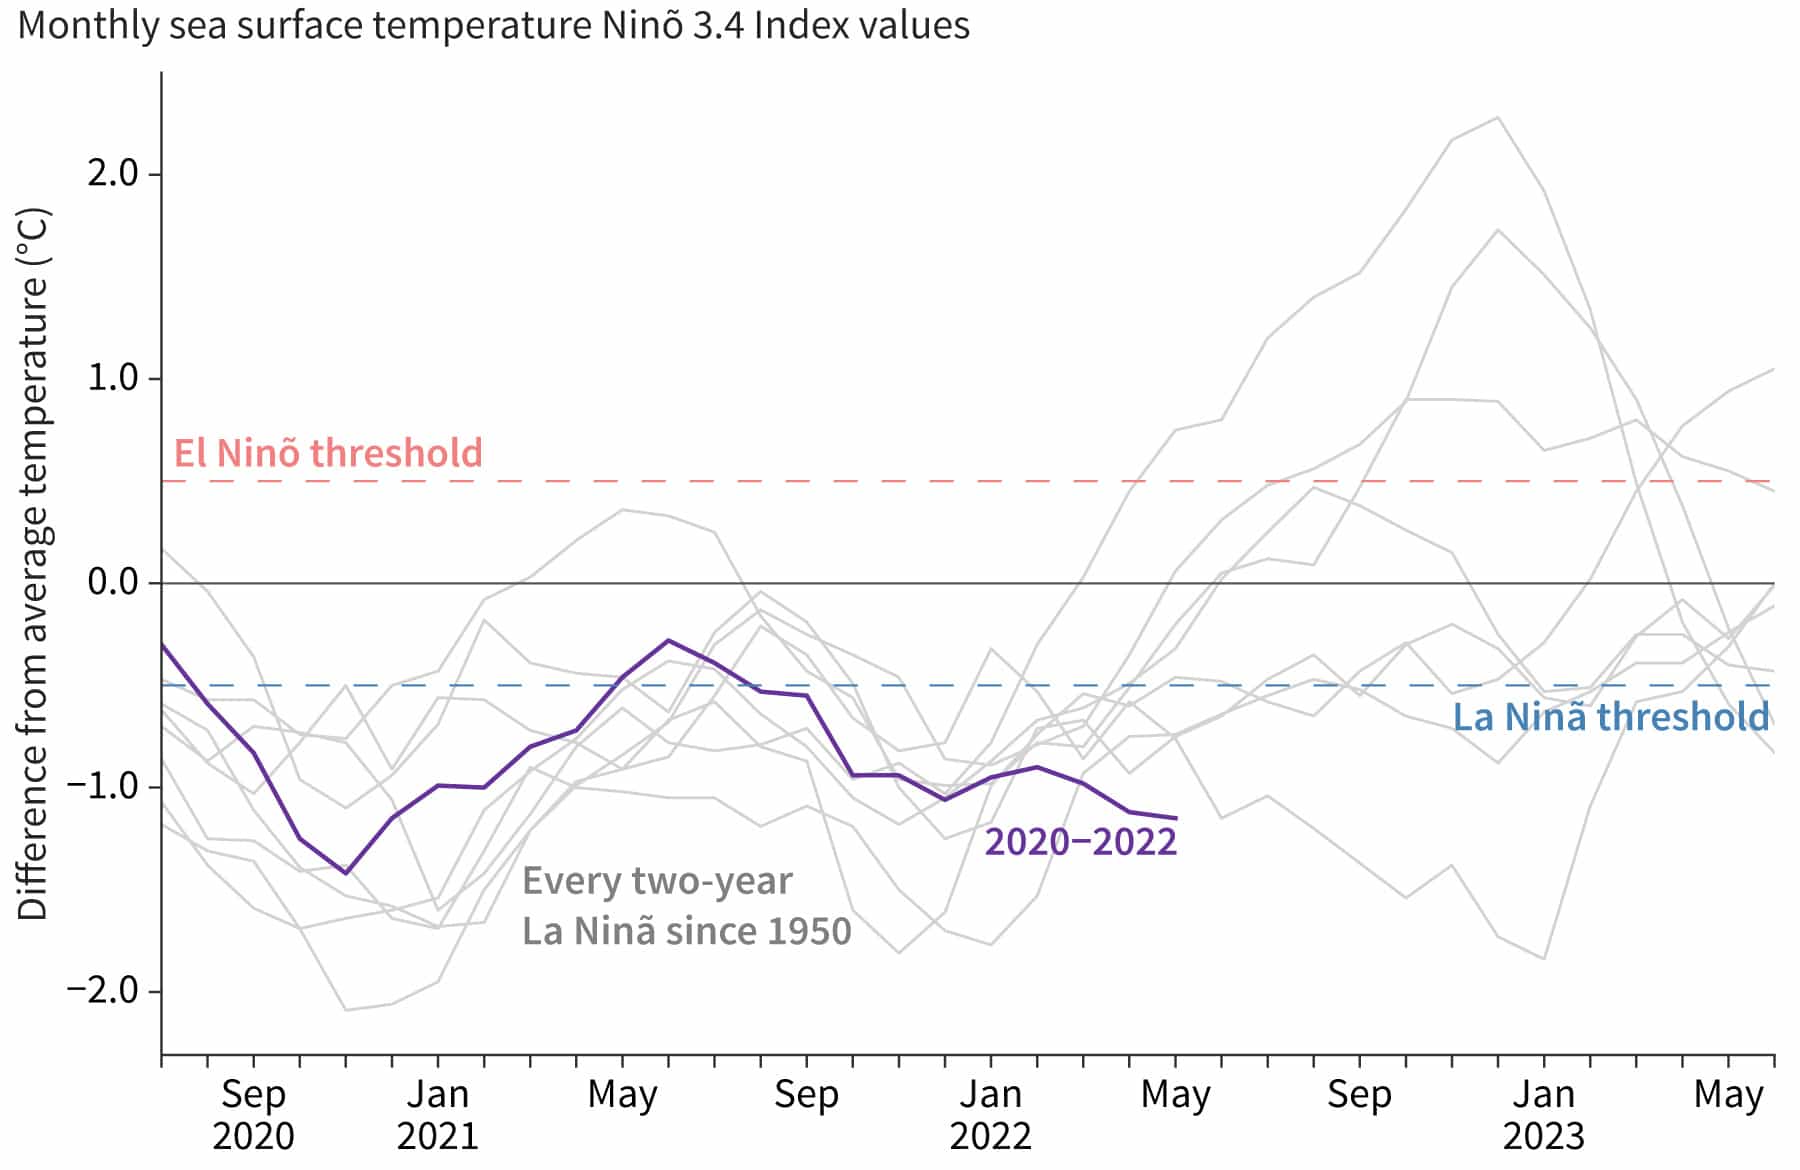
Speaking of broken records, let’s start with the sea surface temperature in the tropical Pacific. The three-month average sea surface temperature anomaly in the Niño-3.4 region, specifically, according to the ERSSTv5 dataset. (The anomaly is the difference from the long-term average; the long-term is currently 1991–2020.) This index, called the Oceanic Niño Index (ONI), is our primary metric for measuring ENSO (El Niño/Southern Oscillation), and the number that shows up in our historical ENSO chart dating back to 1950.
In March-May 2022, the ONI was -1.1°C, the second coolest March-May value we have on record. The first is the 1950s -1.2°C, back at the very beginning of the official record. The La Niña spring of 1950 was followed by a fall and winter that was technically ENSO-neutral but on the cool side.
March-May 2022 is also only the second time during La Niña that the ONI has strengthened from the February–April average (-1.0°C in 2022). The other time that happened was also in the ’50s, with February–April 1955 measuring -0.7°C and March-May -0.8°C. Spring 1955’s La Niña persisted through the summer and strengthened into winter 1955–56.
Looking at monthly averages, May 2022 was the second-strongest La Niña month on record, and by far the coolest of the eight two-year La Niña events that have occurred since 1950.
Plant the seeds
Atmospheric indicators also continue to reflect La Niña, showing signs of a stronger-than-average Walker circulation, including enhanced trade winds and less rain and clouds over the central Pacific. These indicators were a bit weaker than the previous month, though, despite the stronger sea surface temperature anomaly. The cooler-than-average water under the surface of the tropical Pacific also weakened through May. Subsurface water provides a supply to the surface and can give an early hint to the direction we might expect the surface to go.
Many climate models are predicting that the sea surface temperature anomaly will also weaken in the next month or two—something we’ve already started to see over the last couple of weeks. These predictions, in combination with the weakening atmospheric response and reduced amount of cooler subsurface water, are leading to those fairly close probabilities for La Niña and neutral over the summer (52% vs. 46%). However, climate models predict the ONI will become more negative through the fall and winter, although even for those seasons, the potential outcomes are still spread across La Niña and neutral.
Sun and wind and rain
Last month, I discussed the potential implications of a third-year La Niña for the ongoing US drought—check here for updated Drought Monitor and outlooks. This month in Potential La Niña Impacts (PLNI? That’s a terrible acronym!) it’s time to check out the Atlantic and Eastern Pacific hurricane season outlooks. NOAA released the 2022 outlooks late last month. It’s called hurricane season, but this includes both tropical storms, with maximum sustained winds of 39-74 mph, and hurricanes, with maximum sustained winds above 74 mph. I’ll just use “hurricane” here to stand in for both.
In summary, there’s a 65% chance that the Atlantic hurricane season will be above average (both a higher number of storms and overall stronger storms) and a 60% chance that the Eastern Pacific season will be below average. This is based on three categories, similar to the seasonal temperature and precipitation outlooks—above, near, and below-average—each of which would have a 33.3% chance of occurring if you had no other information. Since we have information about ENSO, climate change trends, and other factors, the hurricane season has some predictability, and we can make a forecast.
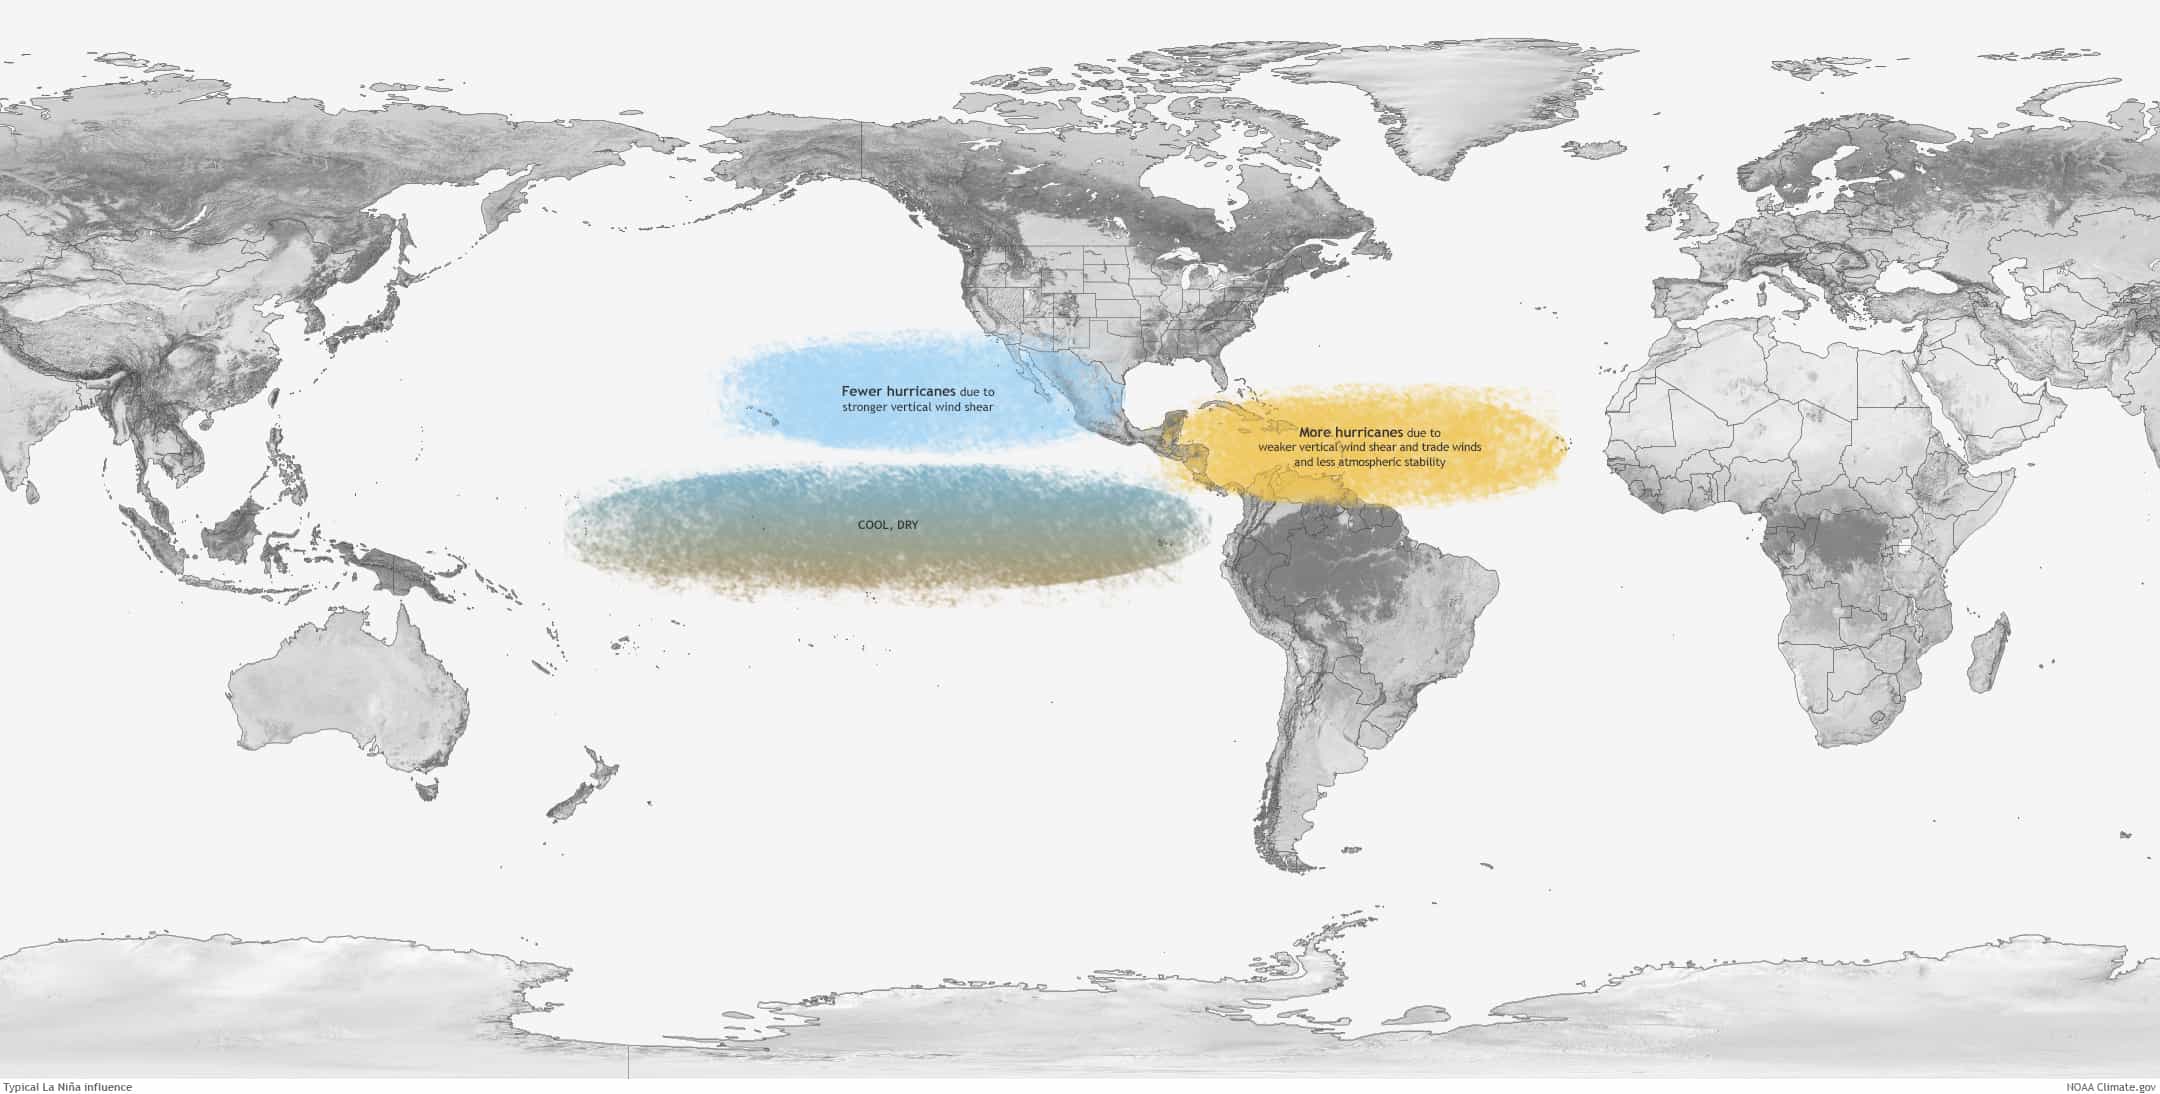
La Niña tends to increase the Atlantic hurricane season and decrease the Eastern Pacific season, primarily through influencing atmospheric shear. Shear is the change in the winds from near-surface to high in the atmosphere. When there is a large change between the lower- and higher-level winds (high shear), hurricanes get torn apart. When this change is reduced, they can grow and strengthen more easily.
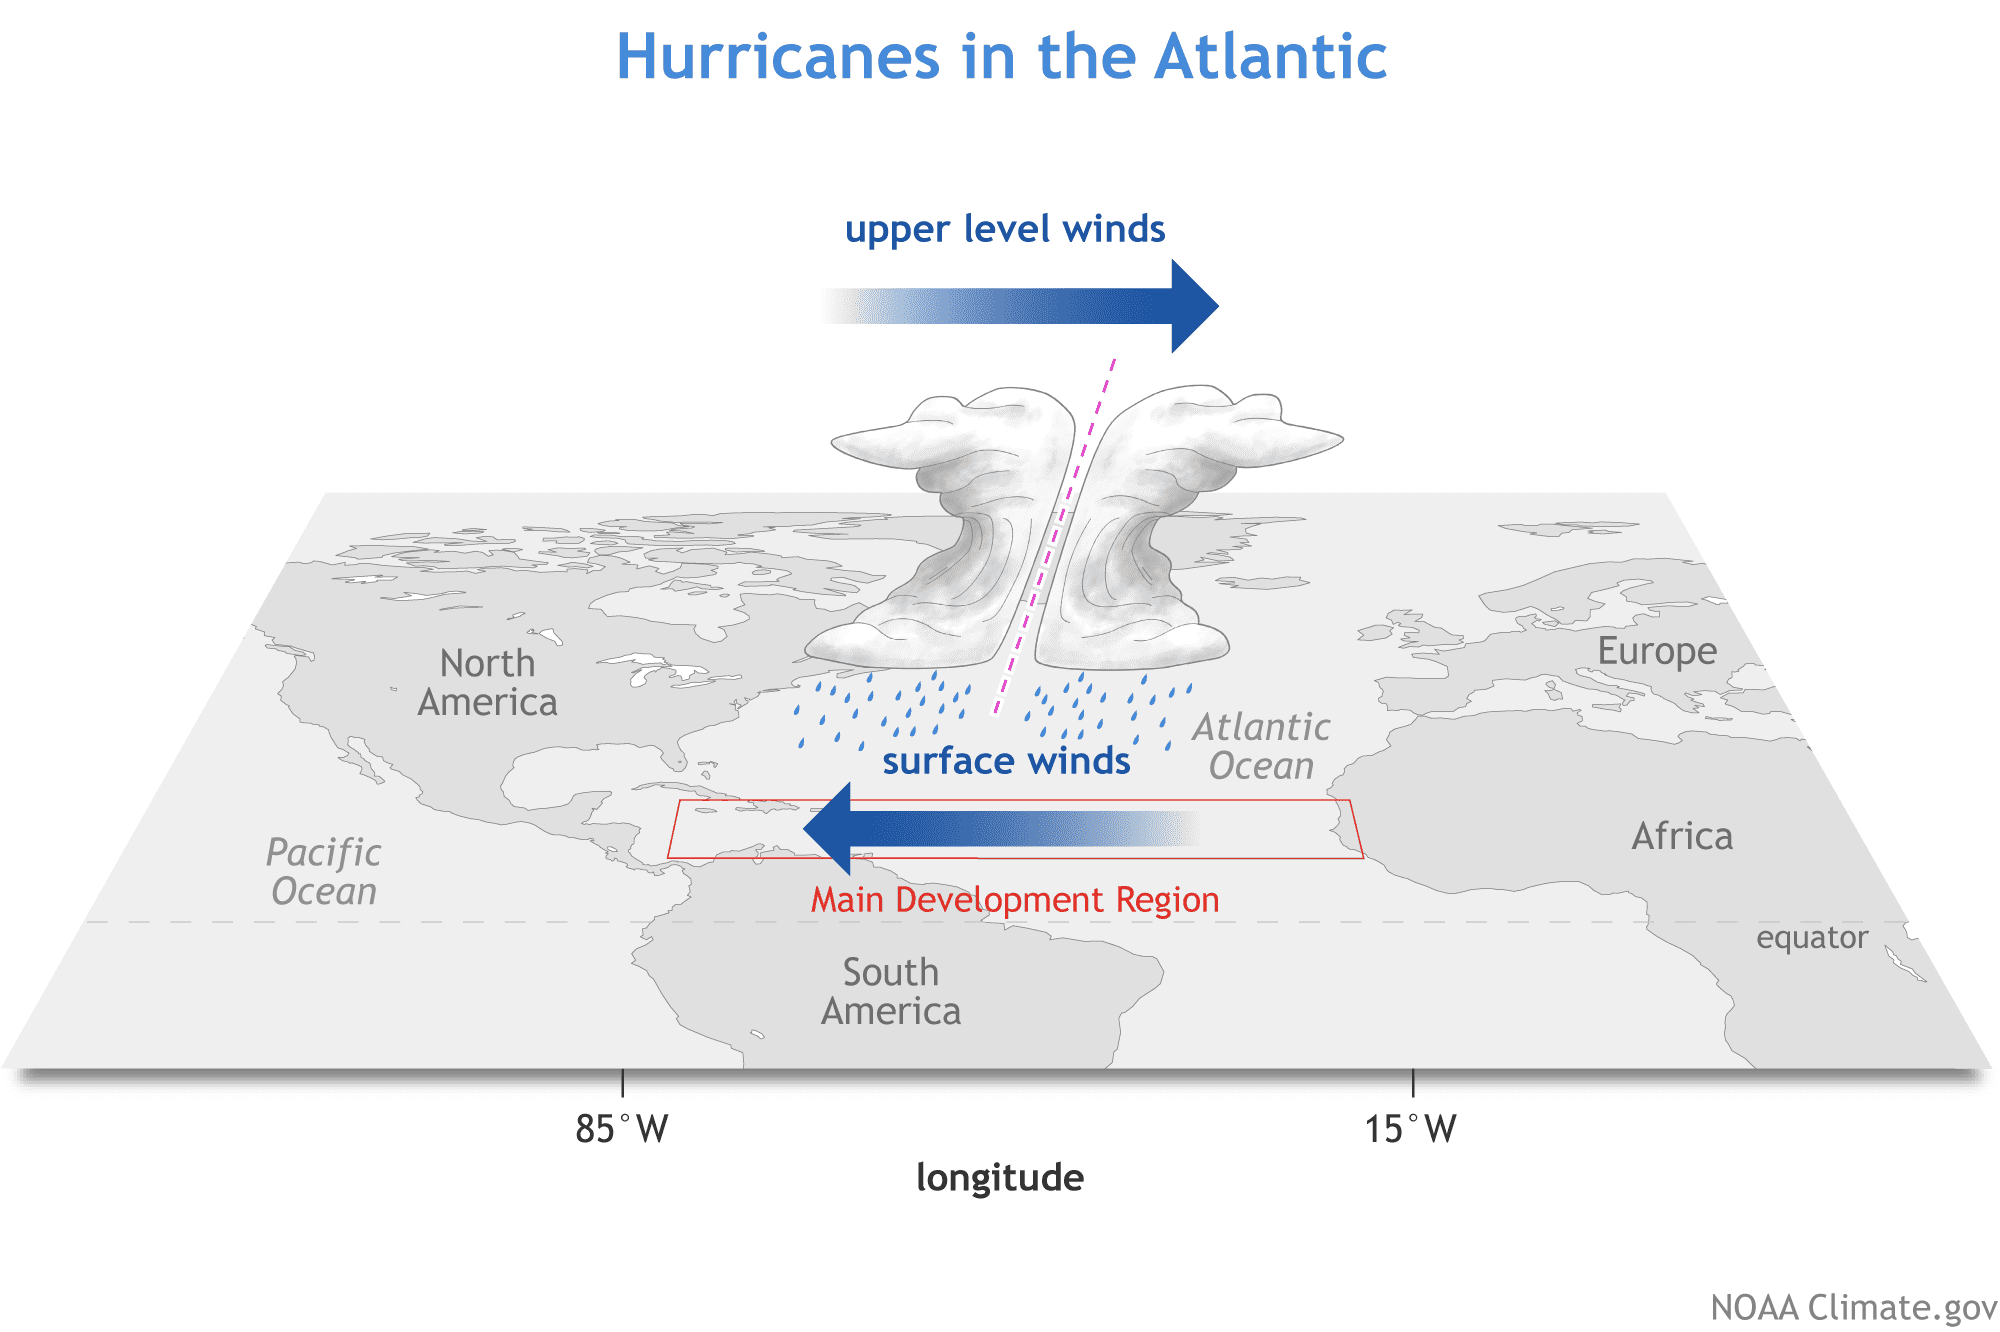
La Niña slows the winds, especially upper-level winds, and decreases shear over the Atlantic Main Development Region, an area of the Atlantic between 10–20°N where most Atlantic tropical storms and hurricanes form.
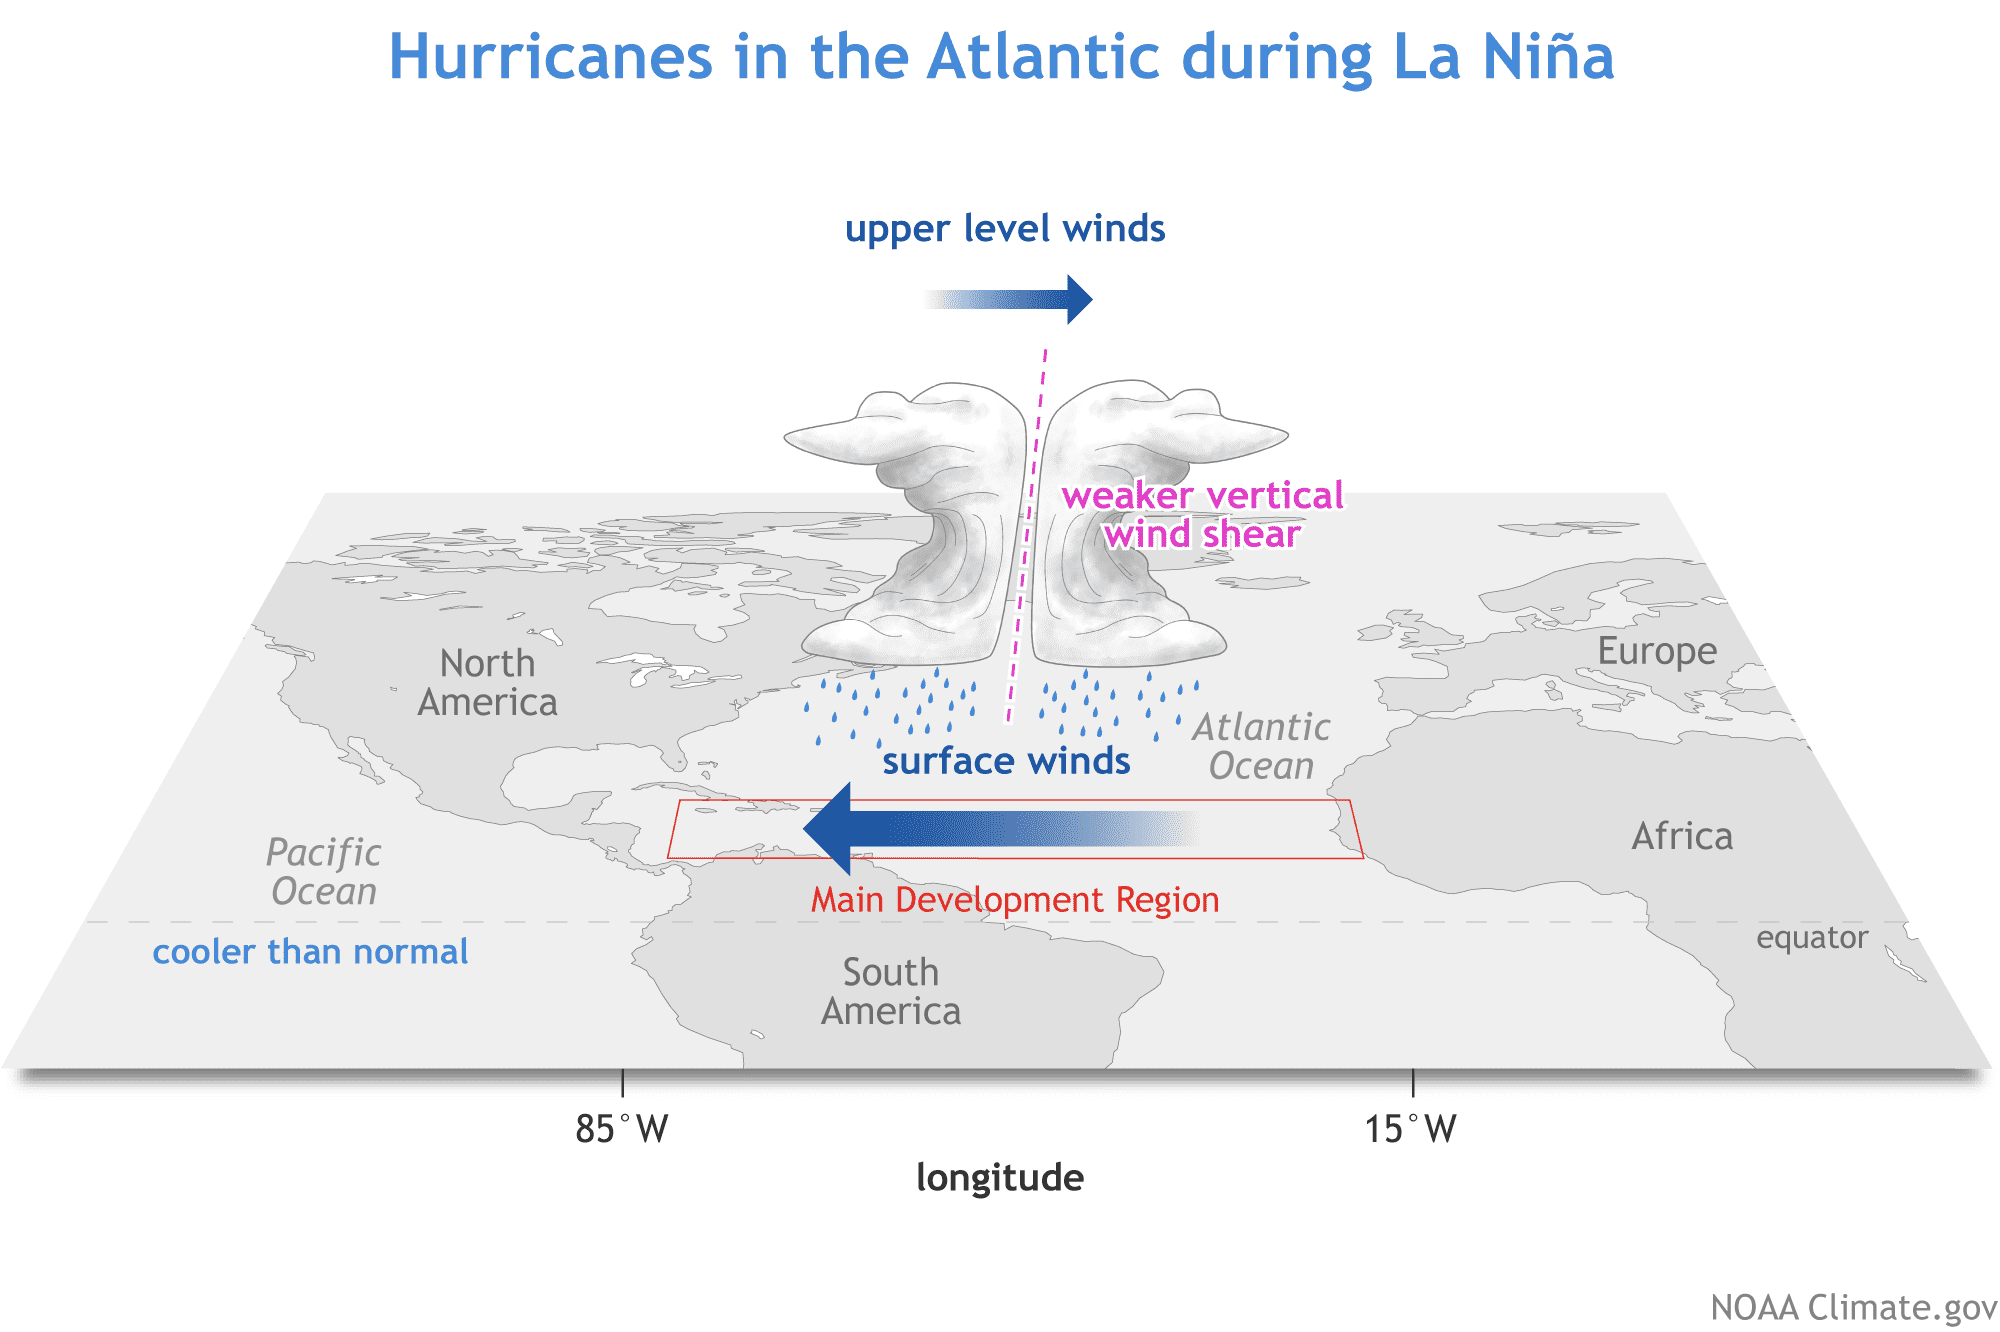
Why does La Niña, which forms in the Pacific, slow the upper-level winds over the Atlantic? La Niña’s cooler central/eastern tropical Pacific ocean surface means more descending motion—part of the stronger Walker circulation. This descending motion draws air at upper levels toward it from all directions (think of a drain in a sink). The winds above the Main Development Region, which generally blow from west to east, are slowed by this pull toward the Pacific.
There are a number of other factors beyond La Niña going into NOAA’s outlooks, but it’s a big component. The outlooks themselves (Atlantic, Eastern Pacific) are very readable and have a ton of interesting nuggets about what to expect in 2022 and the science behind the predictions; I recommend perusing them for more information. Also, NOAA’s official press release has several interesting links about innovations in hurricane monitoring and the prediction of impacts such as storm surges or excessive rainfall.
Finally, if you live in a hurricane-vulnerable area (according to the US Census, this is at least 60 million Americans, not counting those farther inland who are at risk from inland flooding due to heavy rainfall!) it’s always a good idea to be prepared. NOAA has a helpful set of guides for hurricane prep here.
This post first appeared on the climate.gov ENSO blog and was written by Emily Becker.