For what seems like the 247th month in a row, La Niña is still in charge in the tropical Pacific. It’s really only been about a year with continuous La Niña, as it took a break summer 2021 and re-developed October 2021, but it seems like longer! There’s a 75% chance La Niña will be present this winter (December–February); forecasters favor a transition to neutral during February–April 2023.
3 Musketeers
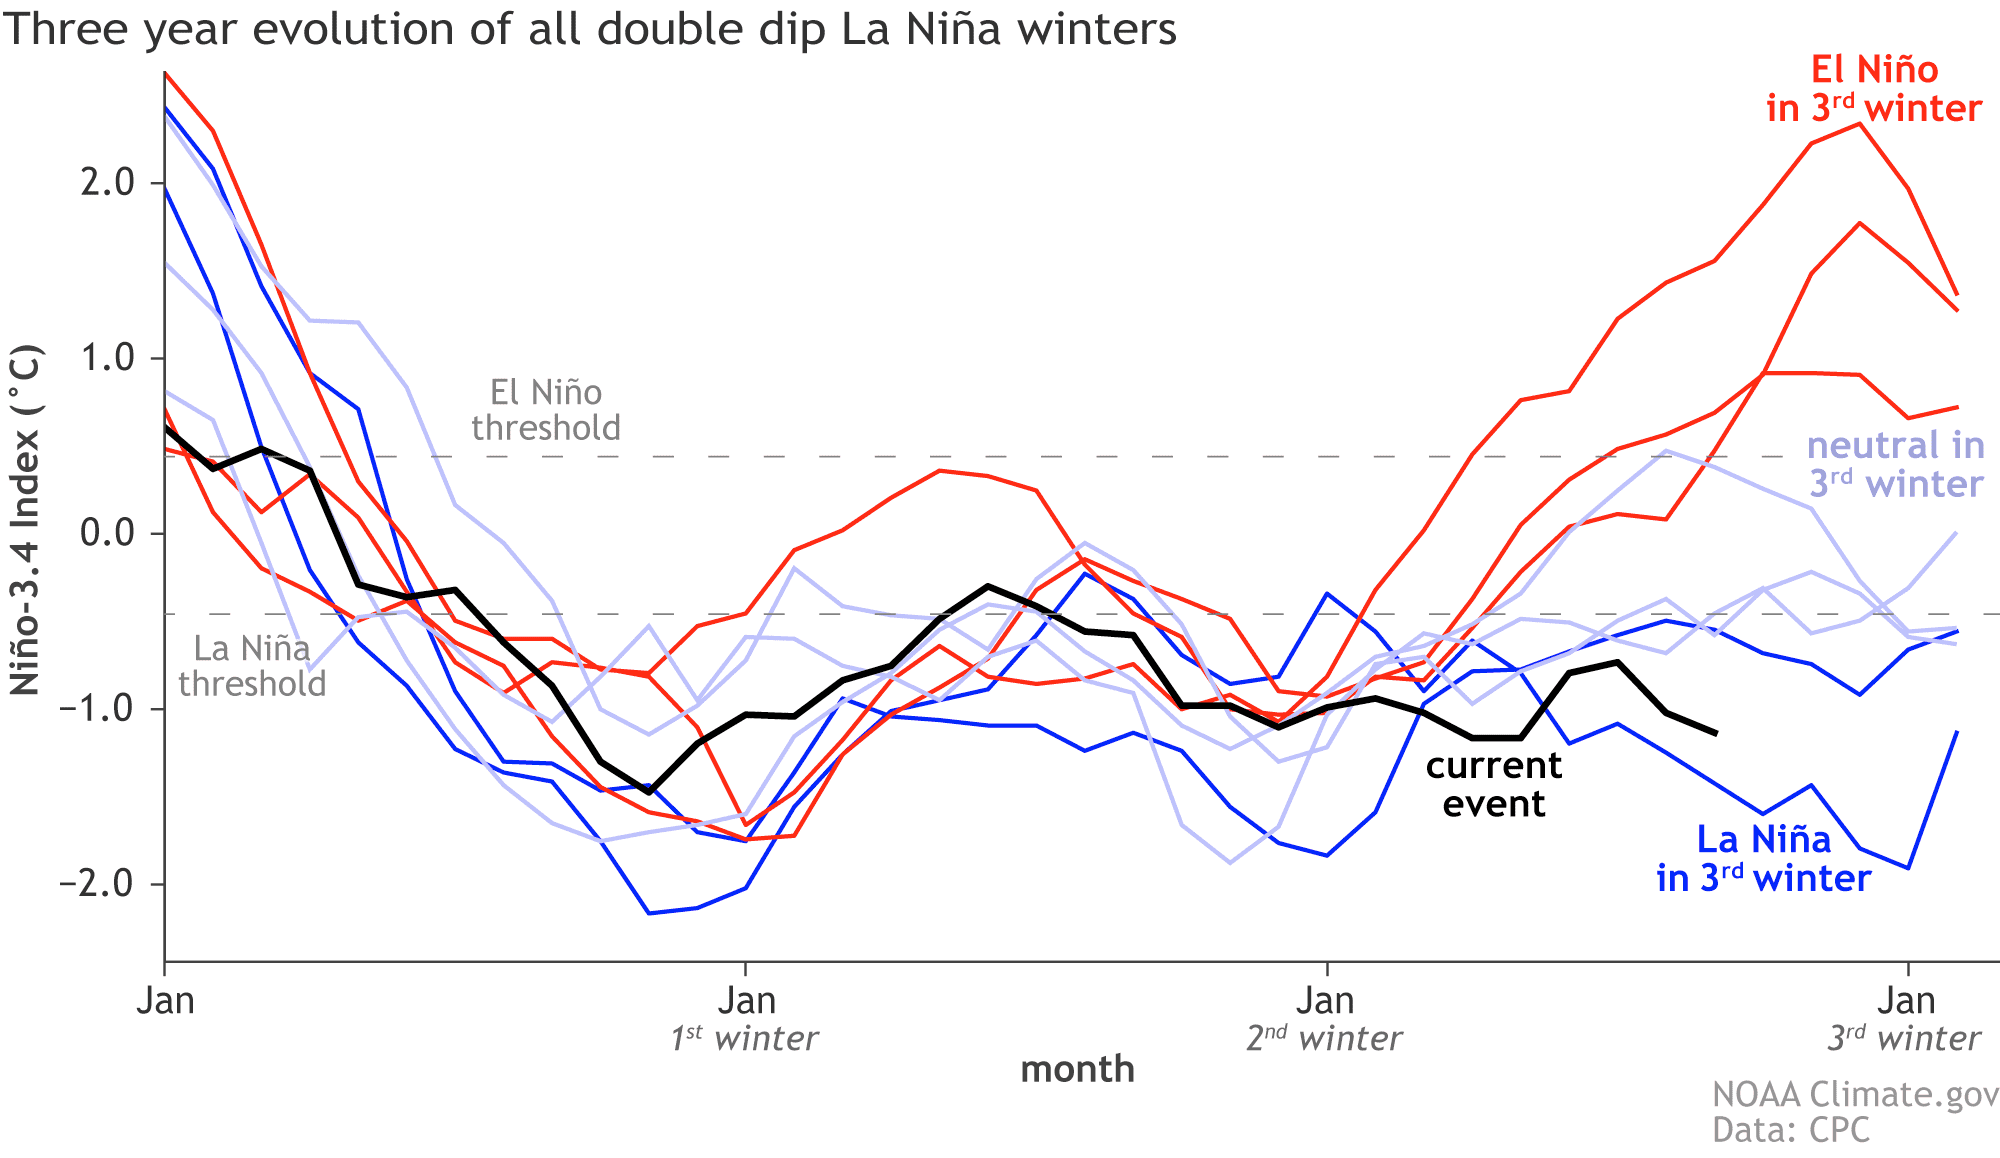
Call it what you like—triple-dip, three-peat, three-bean salad—we are facing the third La Niña winter in a row. This is the third time in our historical record of ENSO (El Niño-Southern Oscillation, the whole El Niño and La Niña system), which dates back to 1950, that we have had three La Niña winters in a row. That’s a lot of threes! The other stretches were 1973–1976 and 1998–2001.
As I mentioned, La Niña conditions took a vacation last summer, but the Niño-3.4 index has been negative since mid-2020. The Niño-3.4 index, our primary measurement for ENSO, measures the difference between current and long-term average sea surface temperature in a specific region in the tropical Pacific, where long-term is currently 1991–2020. According to ERSSTv5, our favorite sea surface temperature dataset, the Niño-3.4 index ticked slightly more negative to -1.1°C in September 2022. This is approximately tied with 1999 for the 6th most negative Niño-3.4 index on record for the month of September.
Kit Kat
Forecasters are very confident that La Niña will continue through the end of the year: the probability of La Niña through October–December is 95%. I got into detail about the sources behind the high level of confidence last month, and they remain the same this month. First, there’s that Niño-3.4 index, substantially exceeding the La Niña threshold of cooler than -0.5°C.
Also, the La Niña atmospheric response is clearly locked in, shown by stronger-than-average near-surface winds along the equatorial Pacific Ocean (the trade winds), less rain than average over the central tropical Pacific, and more rain over Indonesia. All these factors illustrate an enhanced Walker circulation. One of the ways that we measure the Walker circulation is the Southern Oscillation Index (SOI), which relates the surface air pressure over Darwin, Australia to the pressure over Tahiti.
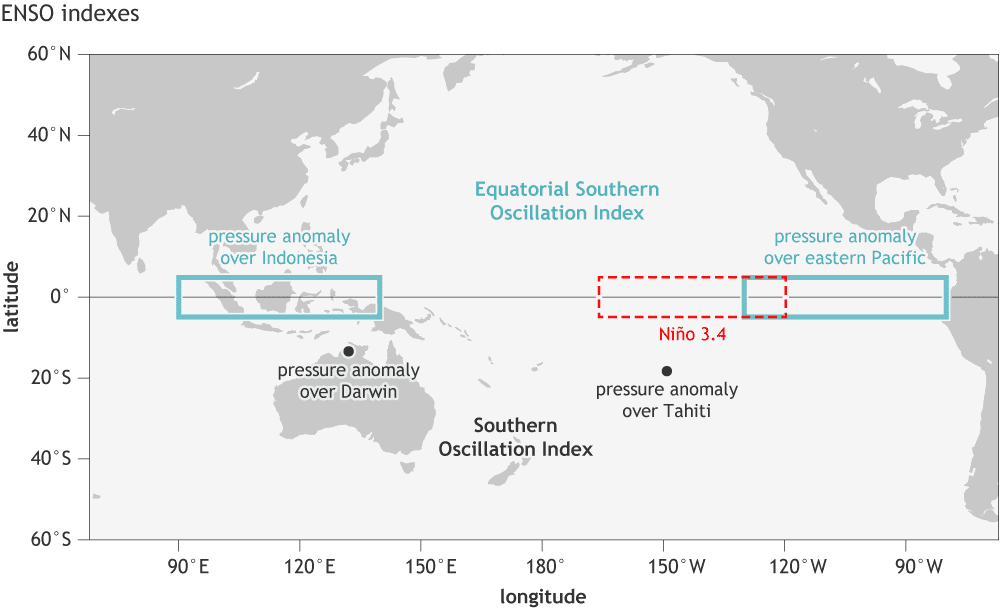
September 2022 was the 4th strongest September SOI since 1950. Another measurement is the Equatorial Southern Oscillation Index, measuring the surface pressure relationship between the eastern and western equatorial Pacific. By this measure, September 2022 was tied for 10th strongest September since 1949. Not quite as impressive, but still a solid indication of the amped-up Walker circulation.
A third factor providing confidence is that there is still a substantial amount of cooler-than-average water under the surface of the tropical Pacific. Our records for the subsurface ocean temperature go back to 1979, and September 2022 is tied for 8th coolest September subsurface. Not a staggering record or anything, but enough to further bolster the forecast confidence. Yet more confidence comes from the computer model forecasts, nearly all of which predict La Niña will linger through the Northern Hemisphere winter.
Skittles
We spend so much time and energy studying La Niña and El Niño because they affect global atmospheric circulation, changing climate patterns in somewhat predictable ways. Check the second half of last month’s post for a collection of La Niña’s potential effect on North American and global weather and climate.
There are many different things that go into a seasonal forecast, but the two biggies are ENSO and recent trends, meaning the tendency of temperature and rain/snow over the recent 10 or 15 years. Tom described how the recent trends work, so take a look at that post for details.
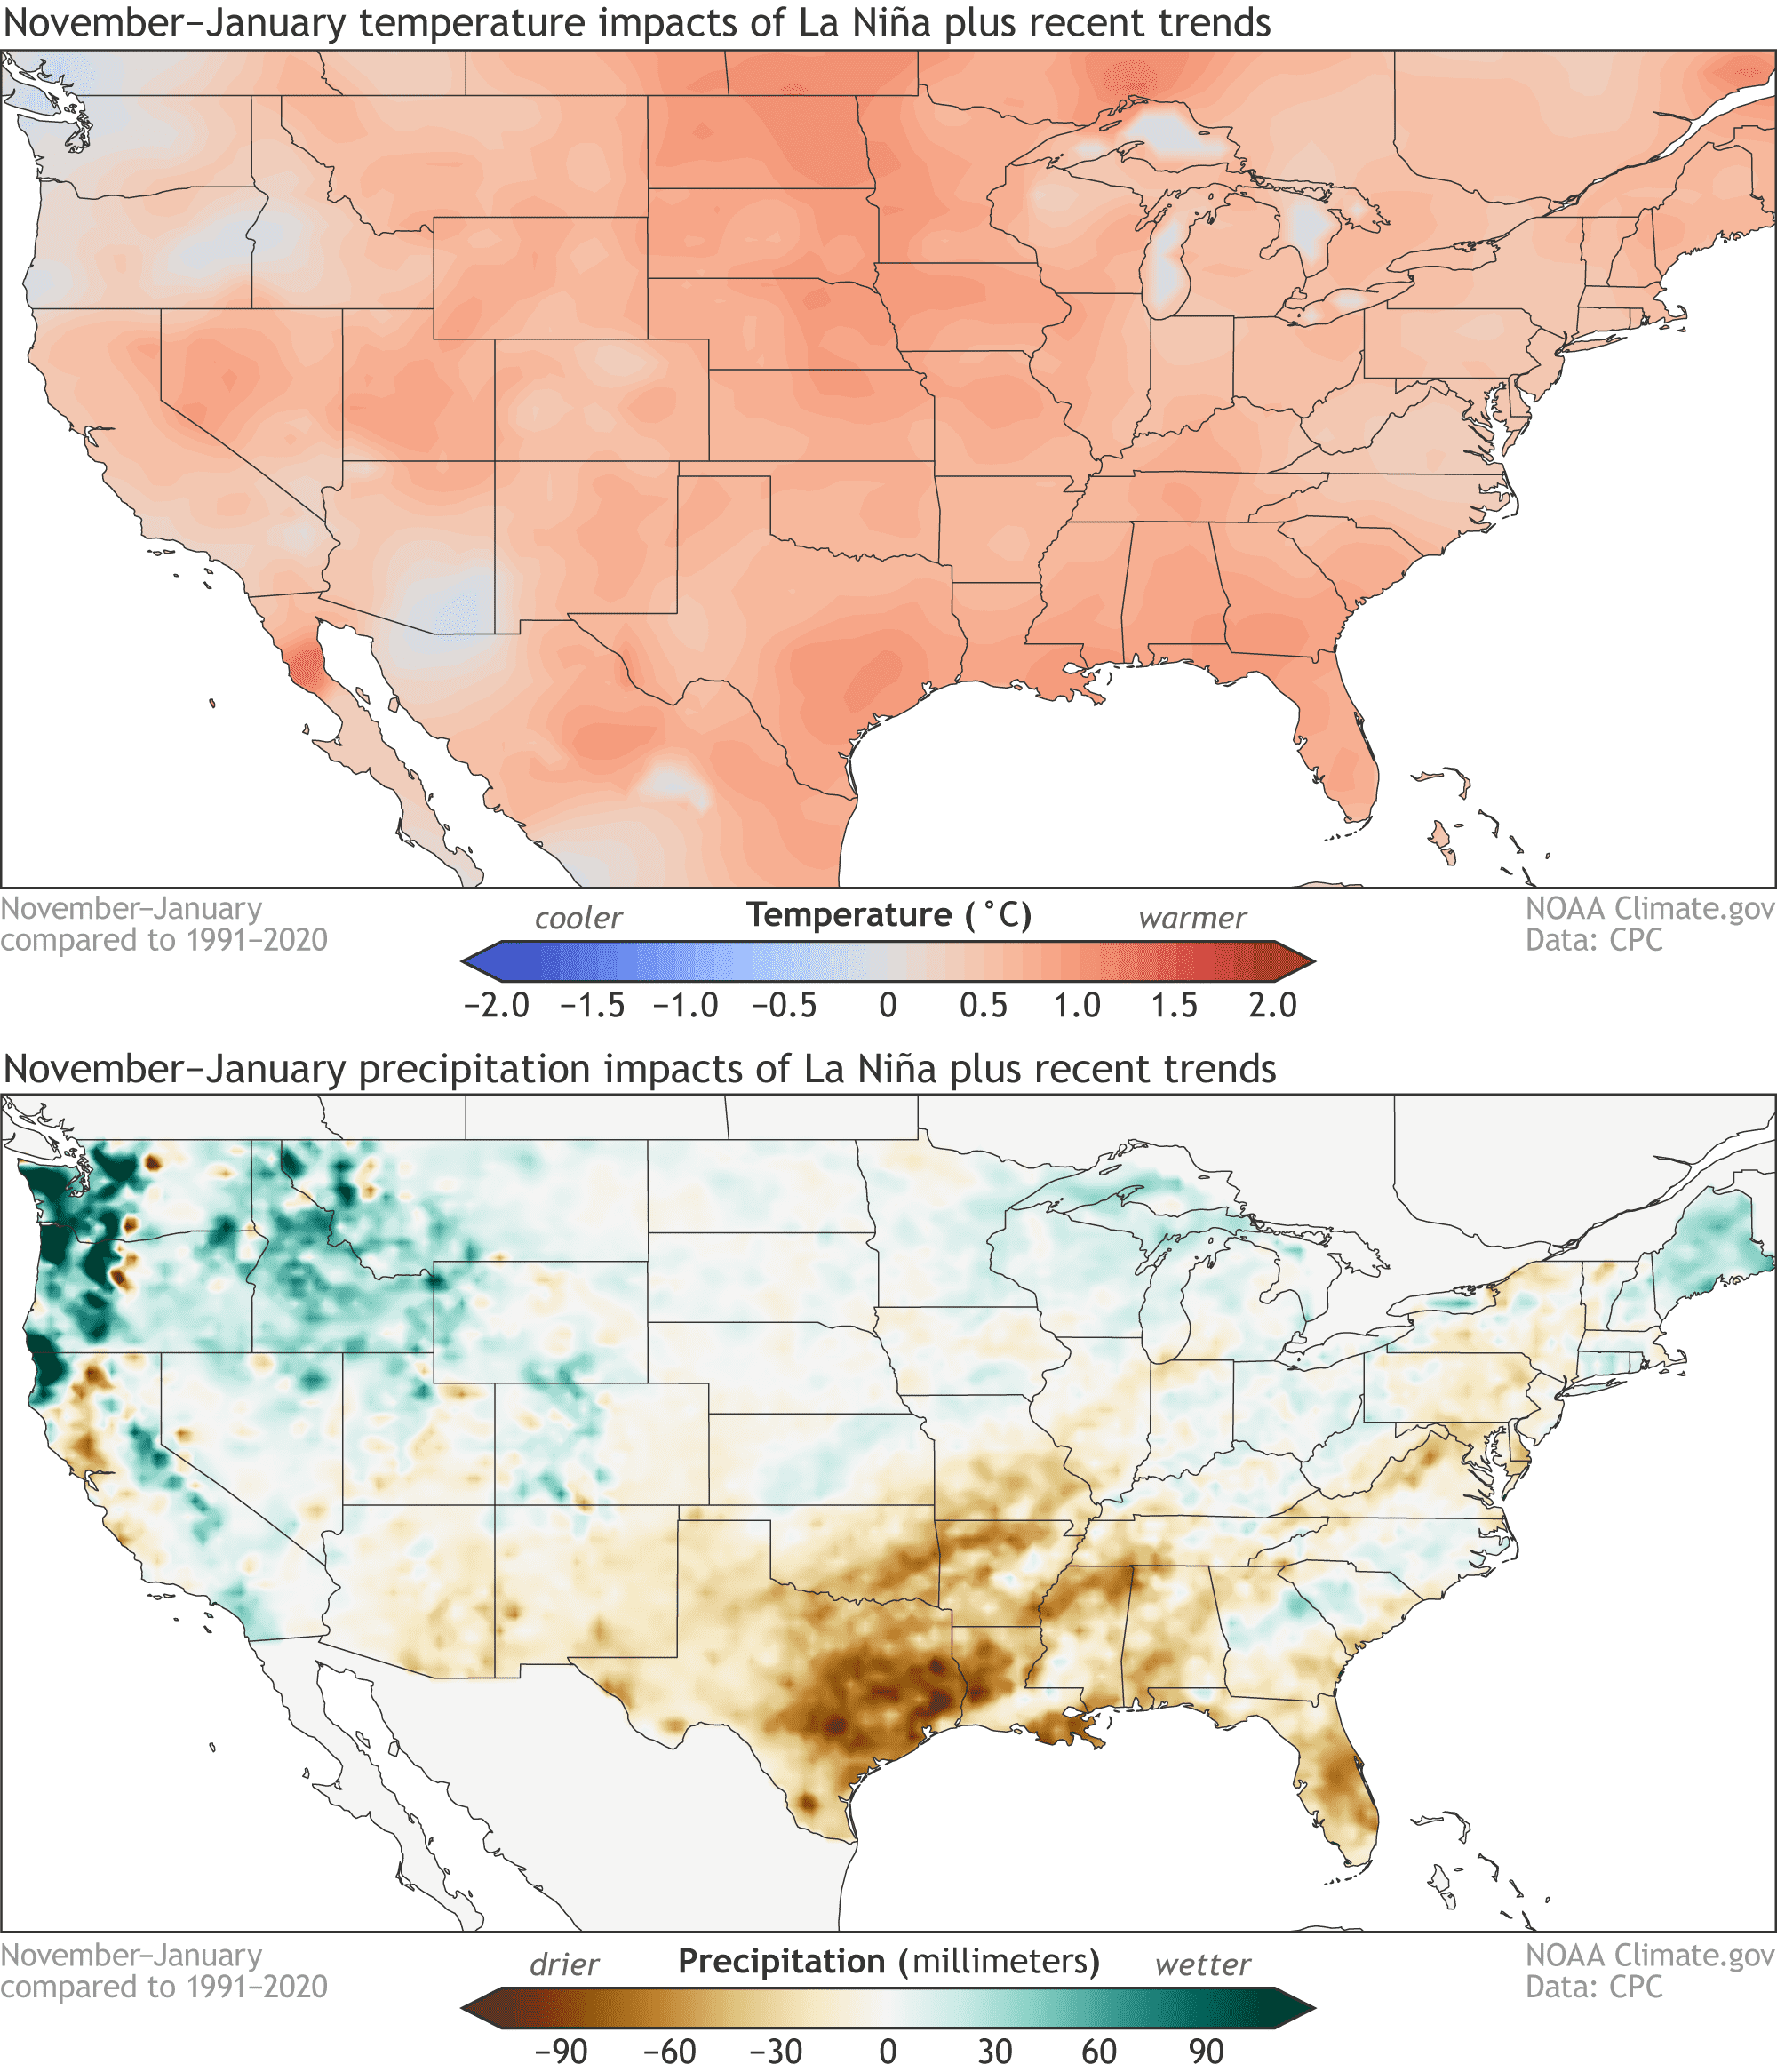
Clearly, when you combine the characteristic temperature pattern of La Niña with recent trends, you end up with a warmer-than-average pattern during November–January over nearly the entire contiguous U.S. (You can see maps with La Niña and trends separated here.) Also, the southern plains tend to be drier than average, with more rain and snow falling in the northwest. (Separated maps here.) The Climate Prediction Center’s updated outlook for the November–January and upcoming winter will be released next Thursday.
This post first appeared on the climate.gov ENSO blog and was written by Emily Becker.