This is a guest post by Dr. Stephen Baxter who is an NOAA Climate Prediction Center (CPC) meteorologist and does applied research on sub-seasonal-to-seasonal climate variability. In particular, he specializes in understanding how the middle-to-high latitude circulation is influenced by the tropics versus other processes. He also has a lot of opinions on Siberian snow cover and the role of the western tropical Pacific in forcing seasonal climate over North America.
The post below first appeared on the climate.gov website in 2017, but as the NOAA has just issued a La Niña watch, we thought it was worth revisiting to get us stoked for winter.
Recent cold air outbreaks over the north-central and northwestern U.S., along with record cold on Veterans Day in parts of the Northeast and Mid-Atlantic, should have people excited about (or dreading) the upcoming winter. My colleagues and I at the Climate Prediction Center have just issued our final outlook for the upcoming “meteorological winter,” that is, December through February. Right now, our official outlook covers only temperature and total precipitation, with the latter combining both liquid and frozen precipitation. However, what about the frozen stuff? What about snow?
- Related: NOAA Issues La Niña Watch: 50-55% Chance of La Niña Developing in Fall and Lasting Through Winter
Because many people remember winters that were either exceptionally snowy or not snowy at all, we get a lot of questions about what the winter forecast portends for seasonal snowfall accumulation. In many parts of the country, snowfall also has major economic and societal ramifications, including water resource management and winter tourism, among others.
Snow Way!
Tackling this problem is not easy, though. Part of the issue boils down to the technical difficulties of snowfall measurements—a real “problem child” as Deke Arndt (NCEI) puts it. The other issue is related to the difficulties with prediction. As many people in the Northeast corridor are aware, snowfall with any given storm system is a function of the dreaded rain-snow line that separates air masses that are below or above freezing.
For any given storm system, the exact boundaries between rain and snow can be hard to predict even days in advance. Luckily, at CPC, we aren’t trying to predict specific events, but the climate instead. We take a step back and see how seasonal temperature and precipitation forecasts might play a role in determining seasonal snowfall accumulation.
In regions that receive a large percentage of their cold-season precipitation in the form of snow, increased seasonal precipitation is intuitively related to increased snowfall accumulation. In more temperate areas that receive a relatively small percentage of frozen precipitation, temperature becomes important. Anomalously cold temperatures are, more or less, a necessary condition for snow in those areas. Therefore, a region with a relatively cold winter may find itself on the cold side of storm systems more often.
In more mountainous areas, where temperature varies as a function of elevation, colder systems result in snow falling at lower altitudes and more total snowfall coverage over a given region. This is where the long-term warming trends, recently discussed by Tom, become important over western North America. Drier and warmer climate signals will generally result in lower snow coverage.
Because a La Niña Advisory was recently issued, we will take a look at how La Niña, in general, affects snowfall across North America. This analysis is part of a broader effort at CPC to better understand and potentially predict seasonal snowfall, made possible in part by a new snowfall dataset (1).
La Niña = Skiers Delight over the Northern United States
In a nutshell, La Niña is associated with a retracted jet stream over the North Pacific Ocean. The retreat of the jet stream results in more blocking high-pressure systems that allow colder air to spill into western and central Canada and parts of the northern contiguous U.S. At the same time, storm track activity across the southern tier of the U.S. is diminished under upper-level high pressure, which also favors milder-than-normal temperatures. The storm track is in turn shifted northward across parts of the Ohio Valley and Great Lakes (2).
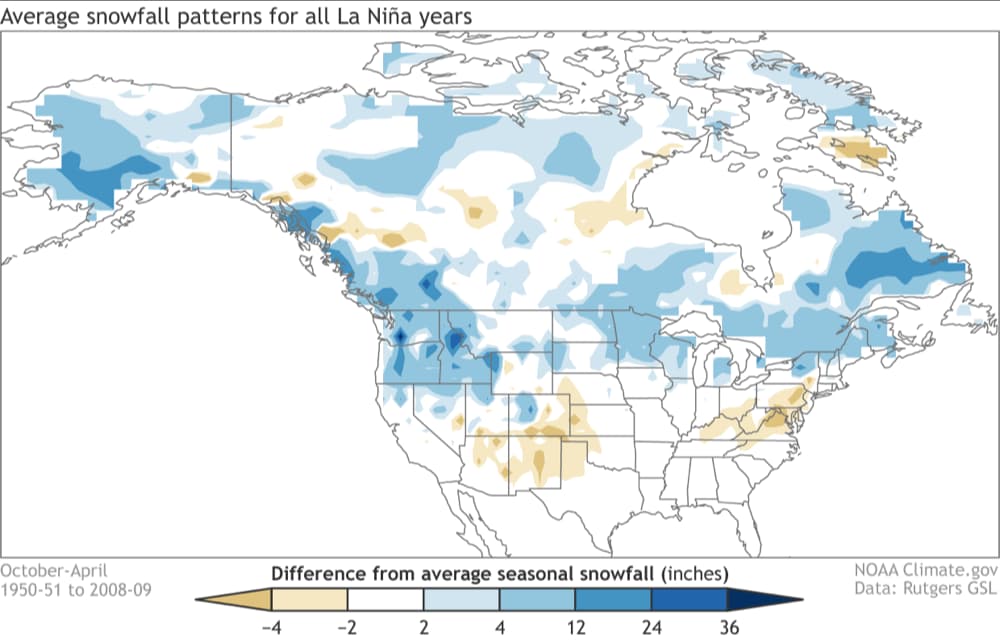
Based on climate analysis (3) from this new snow dataset, we see that La Niña favors increased snowfall over the Northwest and the northern Rockies, as well as in the upper Midwest Great Lakes region. Reduced snowfall is observed over parts of the central-southern Plains, Southwest, and mid-Atlantic.
This La Niña footprint is pretty intuitive. Given the northward shift of the storm track, relatively cold and wet conditions are favored over the northern Rockies and northern Plains, resulting in the enhancement of snowfall. Warmer and drier winters are more likely during La Niña over more southern states, and this is exactly where seasonal snowfall tends to be reduced (4). The more vigorous storm track and slight tilt toward colder temperatures over the northern tier of the U.S. during La Niña modestly increase the chance of a relatively snowy winter.
Snow and Strength
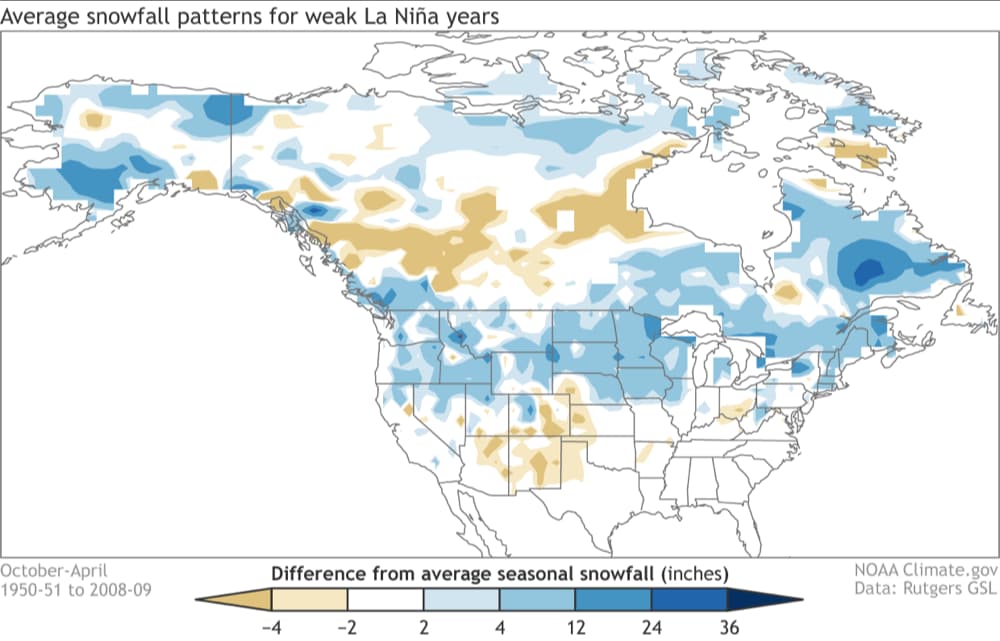
We can break up the snow pattern further and look at the weakest and strongest La Niña events. Splitting La Niña events into strength reveals some interesting differences worth investigating further. In this preliminary analysis below, there is a suggestion that weaker events are snowier over the Northeast and northern and central Plains on average.
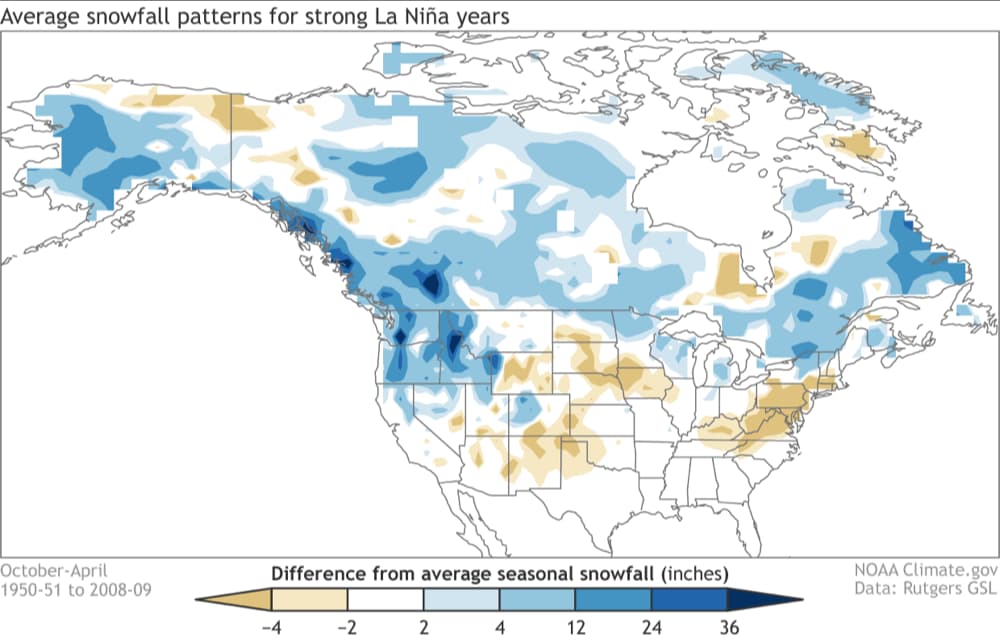
On the other hand, stronger La Niña events (see below) are snowier across the Northwest, the northern Rockies, western Canada, and the Alaska panhandle. Also, there is a tendency toward below average snowfall over the mid-Atlantic, New England, and northern and central Plains, which is not seen during weak La Niña.
Snowfall departure from average for stronger La Niña winters (1950-2009). Blue shading shows where snowfall is greater than average and brown shows where snowfall is less than average. Climate.gov figure based on analysis at CPC using Rutgers gridded snow data.
Overall, stronger La Niña events exert more influence on the winter climate pattern over western North America. Weaker events appear to be associated with more widespread above-average snow over the northern United States. Because a weak La Niña means that the forcing from the Pacific is weaker than normal, it may imply other mechanisms (e.g. Arctic Oscillation) may be at play and is worth further investigation.
The predictability of seasonal snowfall may be somewhat similar to precipitation in that one or two big events can dramatically affect the seasonal average. Thus, in general, the expected prediction skill is likely to be lower than for temperature. However, because temperature also plays an important role in snowfall, some predictability is likely nonetheless. And like for seasonal temperature and precipitation, knowing the state of ENSO is a pretty reasonable place to start.
Lead editor: Michelle L’Heureux
Footnotes