While it’s a little intimidating to put on these oversized shoes, I’m forging ahead in an annual ENSO Blog tradition and giving you all the juicy details about NOAA’s Winter Outlook (1). Regular readers may remember that Mike Halpert of the NOAA Climate Prediction Center (CPC) has been the blog’s winter outlook guru for years, but following Mike’s retirement earlier this year, I’ll be leading you on this year’s journey (Mike, I will try to make you proud!). And maybe my job will be pretty easy this time, given that we are expecting a third consecutive winter with La Niña conditions in the tropical Pacific. What will that mean for this winter? Let’s find out!
Double encore
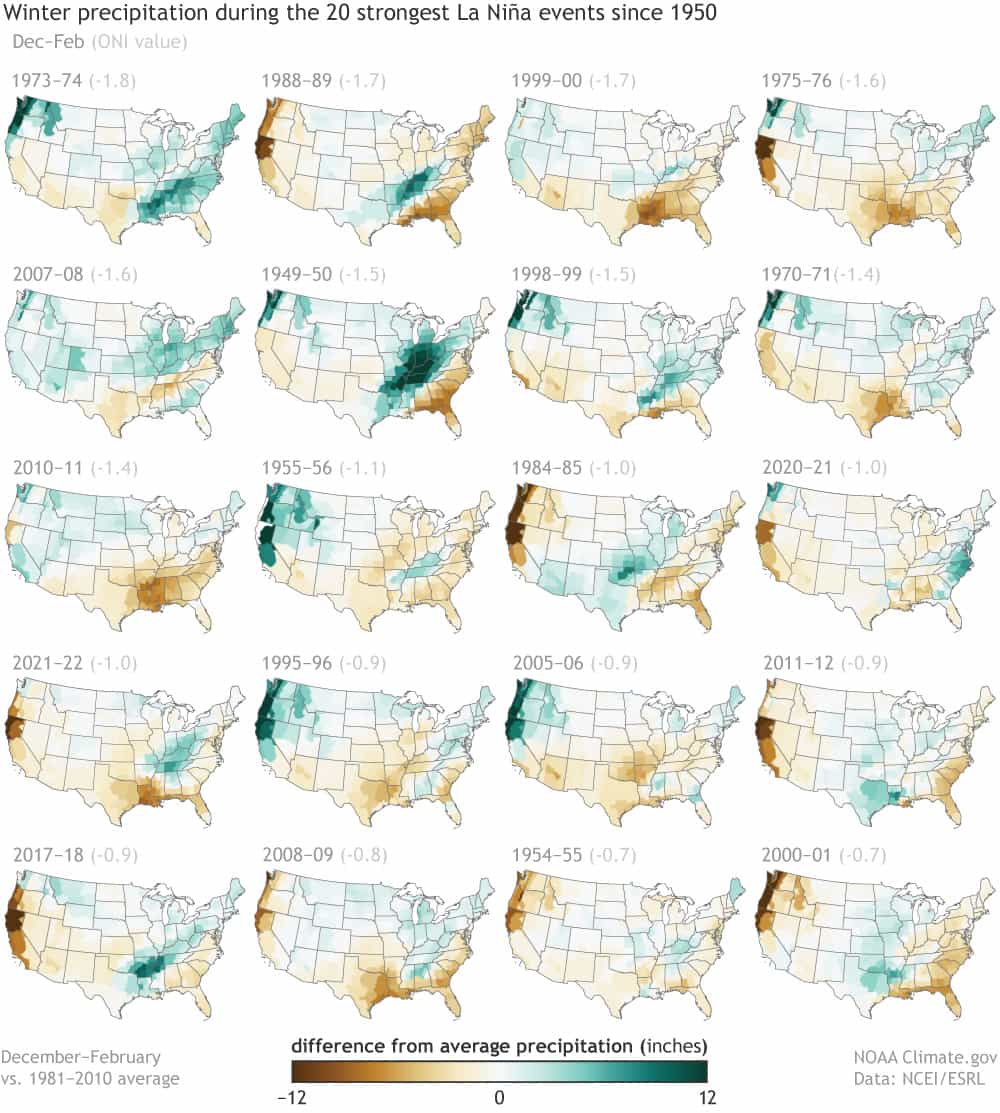
Winter Outlook enthusiasts are likely aware of how much the occurrence of La Niña (as well as El Niño) can shape the outlook, and for good reason: ENSO, the El Niño/Southern Oscillation (the entire El Niño and La Niña system), exerts a significant influence on winter climate over North America. This influence translates into enhanced temperature and precipitation predictability, as previous events often share some common features. For example, as Mike described in each of the past two years, most of the 20 strongest La Niña events since 1950 brought drier-than-average conditions across much of the southern tier of the U. S., particularly along the Gulf Coast. On the flip side, the Great Lakes/Ohio Valley region, the Pacific Northwest, and the northern tier of the U.S. tended to be wetter than average, although there is less consistency to these La Niña impacts.
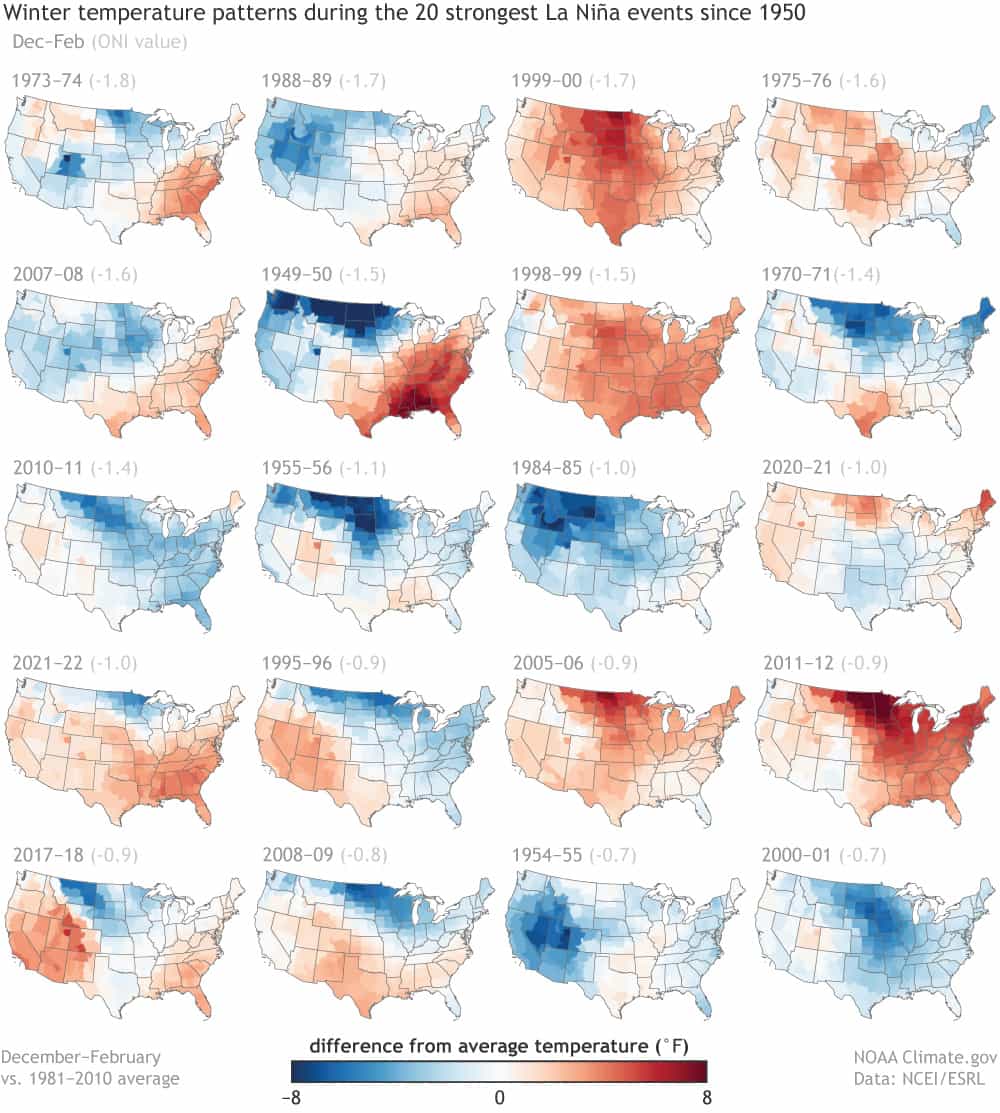
La Niña also influences winter temperatures across the United States, although this effect is combined with another significant influence, the long-term temperature trend. La Niña tends to bring warmer-than-average winters across the southern U.S. and below-average temperatures across the northern Plains, with the frequency of the northern cold and southern warm signals at about 70% in the historical record. However, long-term winter warming over most of the U.S. appears to be enhancing the warmer-than-average tendencies in the south while reducing the cooler-than-average tendencies in the northern Great Plains.
Easy as one-two-three?
With a 76% chance of La Niña through this winter, it’s likely that we will have a third La Niña winter in a row, which would be only the third time since 1950 that this has occurred. What might the previous two occurrences tell us about this winter?
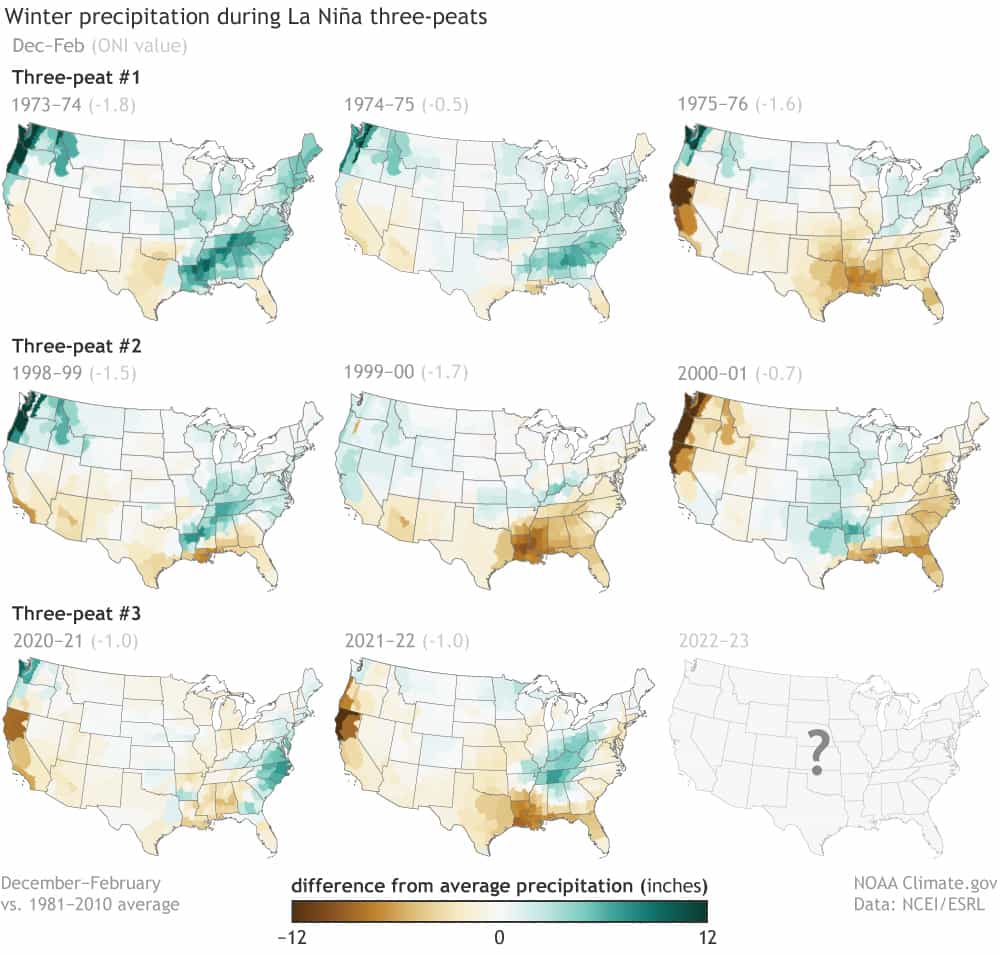
Well, the patterns over the U.S. during the previous La Niña three-peats (2) tell a similar story as the maps for all other La Niñas: generally, a more consistent signal for precipitation, with dry conditions in much of the southern U.S., and higher variability in the temperature patterns.
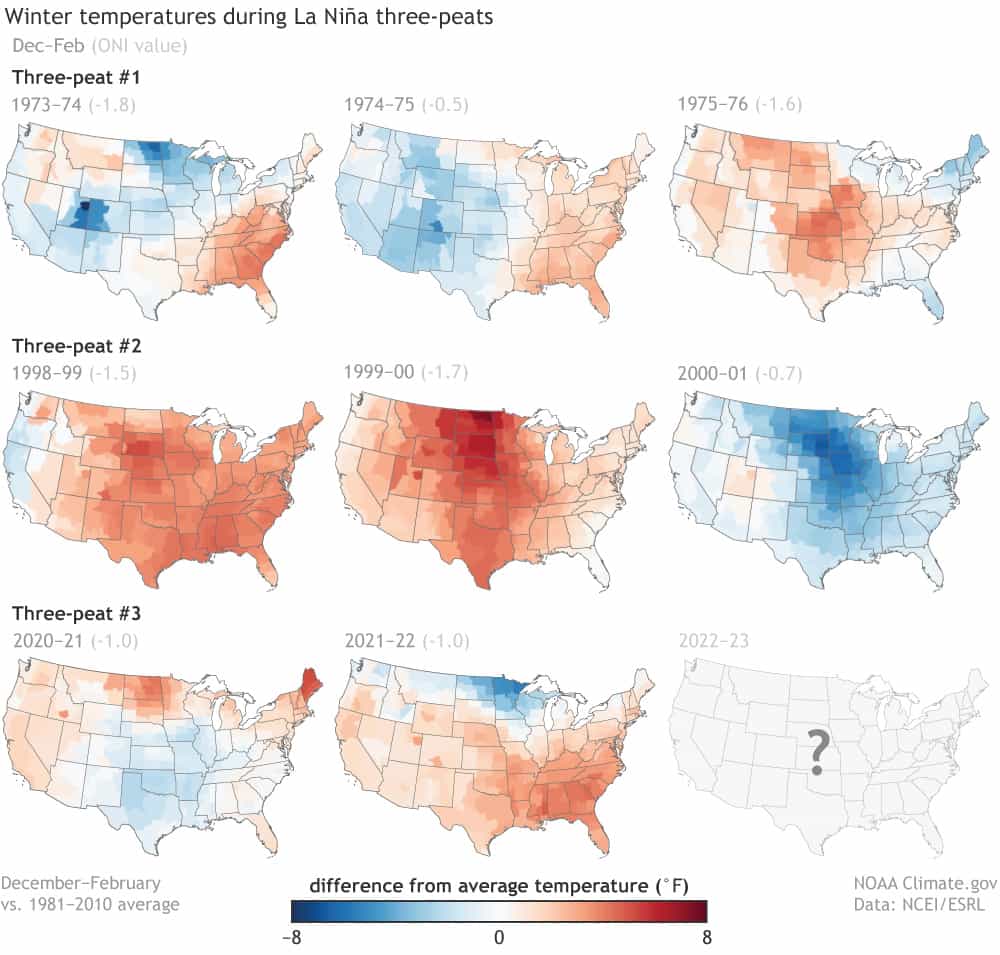
The past two winters fit this description pretty well. The winter of 2020–21 featured a rather unusual temperature pattern (I previously wrote about that befuddling winter), whereas last winter, 2021–22, fit the La Niña temperature mold quite well. However, the precipitation patterns have been more consistent each of these past two winters, which has been bad news for the widespread U.S. drought.
The take-home message is that there is nothing obviously different about La Niña three-peats relative to all other La Niñas that would lead to markedly different expectations. Therefore, it comes as no surprise that this year’s winter outlook has a lot of similarities with the previous two.
The outlook!
Enough with the preamble, let’s get to the outlook! As noted above, CPC favors a similar temperature pattern taking shape this winter as they forecast before the last two winters.
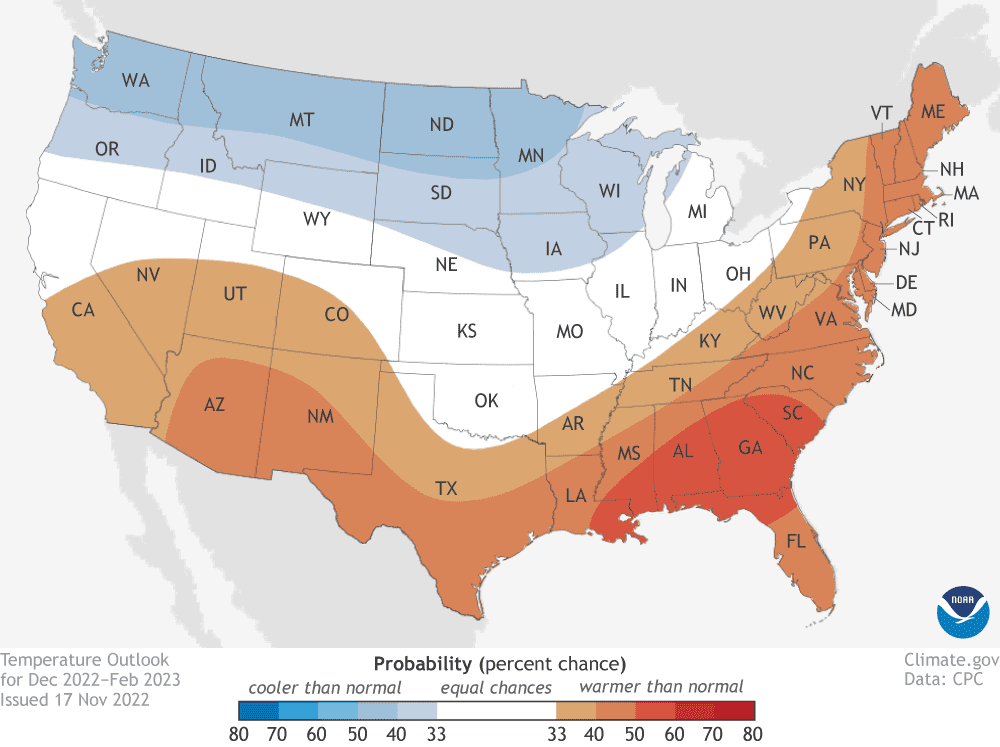
Specifically, the CPC outlook (3) favors above-normal temperatures across the southern and eastern U.S., with the highest probabilities exceeding 50% in the eastern Gulf and South Atlantic states from southeastern Louisiana through most of South Carolina. Above-average temperatures are also favored for Hawaii and northwestern Alaska. The outlook tilts the odds toward colder-than-average across the Pacific Northwest, northern Great Plains, and southeastern Alaska, although none of the below-average probabilities reaches 50%.
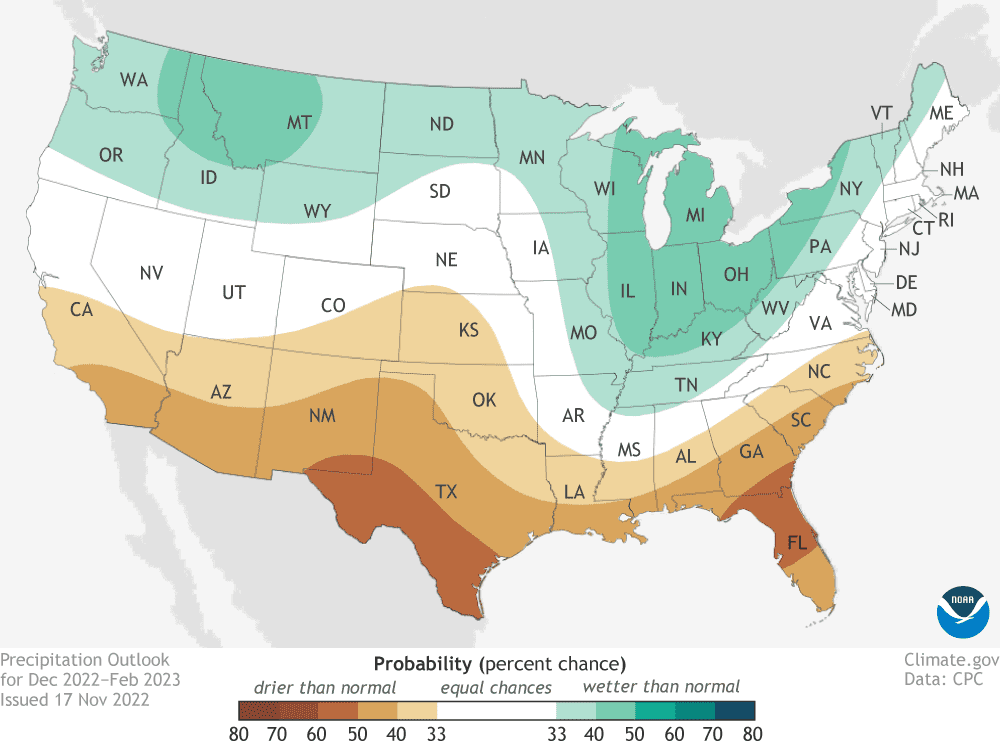
The precipitation outlook favors above-normal precipitation across the northern tier of the U.S., with the largest probabilities in northern Idaho, western Montana, and in the Great Lakes and Ohio Valley regions. Wetter conditions are favored in Hawaii as well, and this is the only U.S. location where the probability of above-normal precipitation exceeds 50%. In contrast, the entire southern tier of the country and southeastern Alaska have an elevated chance of drier-than-normal conditions, with probabilities exceeding 50% in southern Texas, northern Florida, and southeastern Georgia. Unfortunately, this means that we are not expecting any immediate drought relief in the Southwest and southern Great Plains, and drought may even expand into the Southeast, but hopefully we will see some improvement in the more northern drought-stricken regions.
The usual wildcards
Truth be told, the actual winter conditions never perfectly match the typical La Niña/El Niño impacts or CPC’s Winter Outlook, and frankly, sometimes they can look quite different (I’m still looking at you, winter of 2020–21). One of the main reasons is that there are several other important factors that can influence the average winter conditions, including sudden stratospheric warmings, the Madden-Julian Oscillation (MJO), the Arctic Oscillation/North Atlantic Oscillation, the North Pacific Oscillation-West Pacific teleconnection, and the Pacific/North American pattern.
That may lead you to ask, “Well, Nat, if we know that these other factors can be important, why aren’t they clearly reflected in CPC’s Winter Outlook?” Good question! The reason is that even though, like ENSO, these other factors can leave a big imprint on average winter conditions, unlike ENSO, they’re very difficult to predict more than a few weeks in advance. From a seasonal forecaster’s perspective, these other non-ENSO factors fall into the dreaded “internal variability” category that Michelle wrote about last year (4). However, because they generally have at least some sub-seasonal predictability, their impacts are often reflected in CPC’s shorter-term outlooks, including their Monthly, Week 3-4, 8 to 14 Day, and 6 to 10 Day outlooks.
Probabilities are not guarantees
The uncertainty stemming from these other factors also highlights why CPC’s Winter Outlook is expressed in terms of probabilities, which means that the forecasts won’t always result in the favored (or expected) outcome. Nevertheless, these outlooks still allow users to take risk and opportunities into account when making climate-sensitive decisions. Benefiting from these outlooks requires users to play the long game. Although some forecasts will “bust,” these outlooks have a track record of demonstrated skill, so users who stick around for the long haul will come out ahead.
Footnotes
- This post discusses the November update to NOAA’s Winter Outlook that was originally released in October. The NOAA Climate Prediction Center’s seasonal outlooks are updated each month all year long, but the November update to the Winter Outlook is the forecast that is used for verification.
- Note that I am identifying “three-year La Niñas” or “La Niña three-peats” as three consecutive winters with La Niña conditions. The 1973–1976 and the current episodes had a few three-month periods from late spring to early fall that returned to ENSO neutral, but La Niña conditions had returned before the following winter.
- A standard reminder about the format of CPC outlooks: the forecasts show the probability of one of three favored categories: below-, near-, and above-normal. The three categories are defined by terciles in the temperature or precipitation distributions. The terciles are the 33.33 and 66.67 percentile positions in the distribution. In other words, they are the boundaries between the lower and middle thirds of the distribution, and between the middle and upper thirds. The below-normal category represents the lower third, and the above-normal category represents the upper third of the distributions.
Also note that forecasts are indicated only when there is a favored category; otherwise, they show EC (“equal chances”). An EC forecast doesn’t mean that near-average temperature or precipitation is expected this winter in those regions, but rather that there’s no tilt in the odds toward any of the three outcomes. In the maps, the probability is shown only for the favored category, but not for the other two categories. Often, the near-normal category remains at 33.33, and the category opposite the favored one is below 33.33 by the same amount that the favored category is above 33.33. When the probability of the favored category becomes very large, such as 70% (which is very rare for a seasonal outlook), this rule for assigning the probabilities for the two non-favored categories becomes different. - In the interest of accuracy, I note that ENSO does impact some of these other factors, especially the Pacific/North American (PNA) pattern. In fact, ENSO’s main impact on atmospheric circulation beyond the tropics is through a pattern that resembles the PNA, but as Michelle wrote previously, even the PNA has a substantial amount of variability that cannot be explained by ENSO.
This post first appeared on the climate.gov ENSO blog and was written by Nat Johnson.