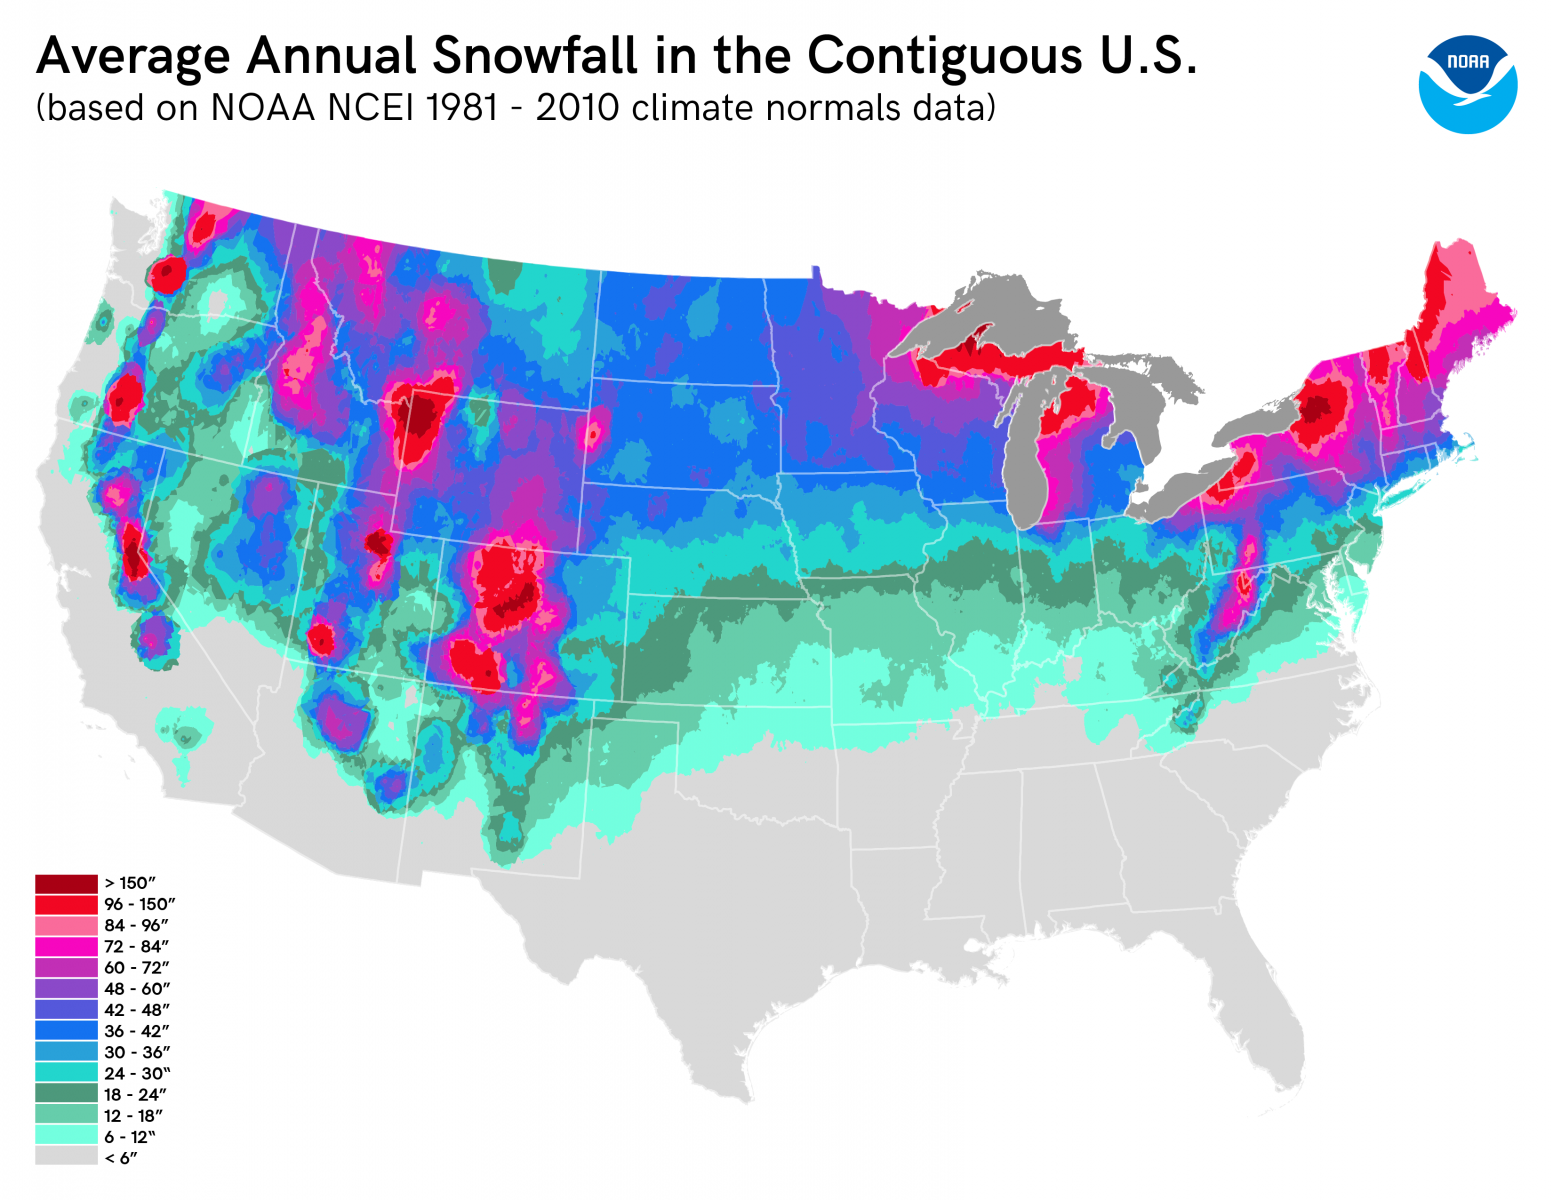
A map of average annual snowfall in the contiguous U.S. visually explained.
Dark red zones on this map are where we want to be!
The Dark Red Zones:
- Sierra Nevada Range, CA/NV
- Teton Range, WY
- Wasatch Range, UT
- Front Range, CO
- Cascade Range, OR & WA
Related: NOAA April 2021 Outlook: Warmer and Drier Than Normal For Majority of Country
A map like this will never be able to account for areas as small as the top of the Green Mountain spine. And the audience for this data is not skiers. It’s still useful.
Yeah this map is not even close. For example, the Park Range in CO should be the darkest color within that state, along with the southwestern San Juans. And how is the Mt. Baker area in north central Washington not completely dark red?! And the southern Sierras (Mammoth area) should be dark red like the central Sierras.
NOT accurate, not even close. The Adirondacks of upstate NY and New Hampshire, and Vermont, except for maybe Jay Peak, don’t get red zone snow. Neither does most of Colorado. If Grand Targhee and Alta get red zone snow then other areas like the above need to be another color!
Look at the map key. dark red means 150″+ of snow, which all of those places get way more of.