


This post first appeared on climate.gov and was written by Rebecca Lindsey
According to the latest monthly global climate summary from NOAA’s National Centers for Environmental Information (NCEI), May 2021 was among the top-ten warmest Mays on record:
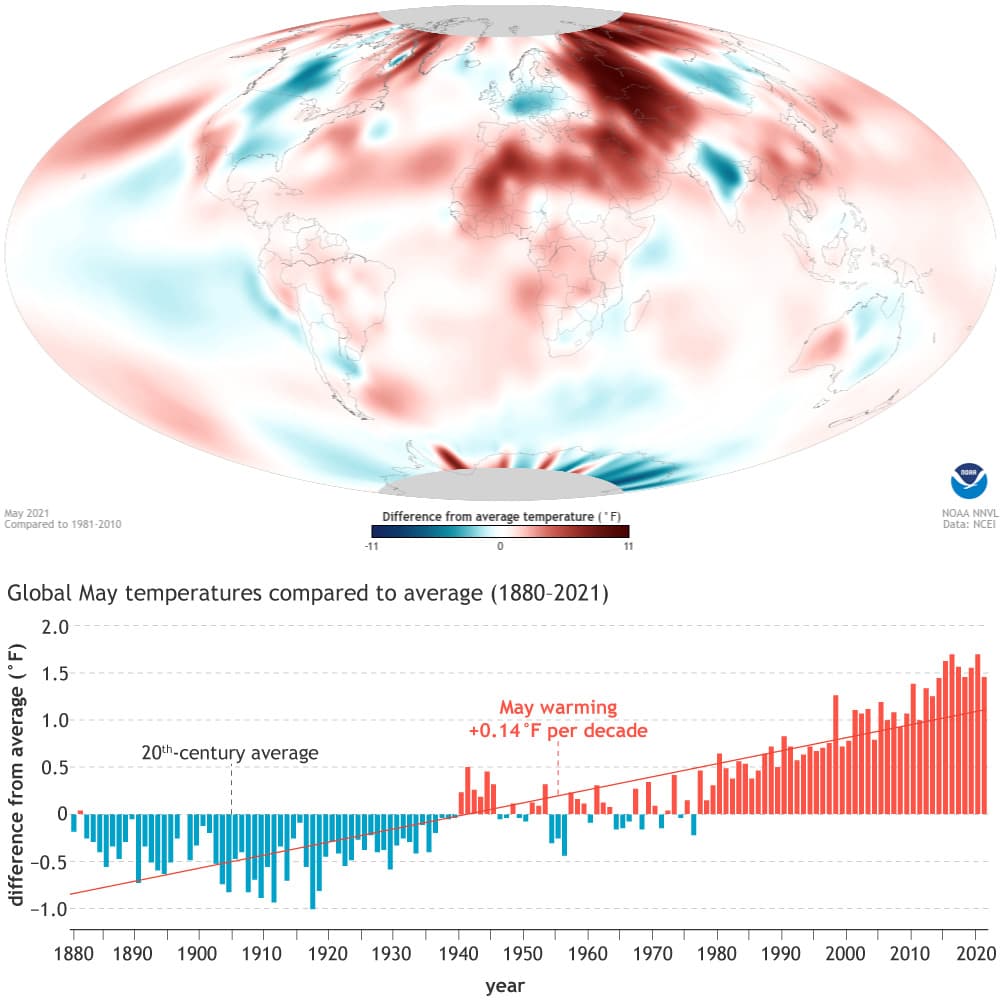
The May 2021 global surface temperature was 1.46°F (0.81°C) above the 20th-century average of 58.6°F (14.8°C), tying with 2018 as the sixth-warmest May in the 142-year record. May 2021 marked the 45th consecutive May and the 437th consecutive month with temperatures, at least nominally, above the 20th-century average.
Temperatures were much above average across parts of northern, western and southeastern Asia, Africa, northern South America and across parts of the Pacific, Atlantic, and the Indian Oceans. Temperatures were cooler than average across parts of North America, the eastern Pacific Ocean, central Europe, central Asia and India.
Regionally, Asia had its second-warmest May on record, behind May 2020. Africa had its sixth-warmest May on record. Meanwhile, Europe and North America had their coolest May since 2004 and 2011, respectively.
The map shows how temperatures in May 2021 compared to the 1981-2010 average across the globe. Places that were up to 9 degrees Fahrenheit warmer than average are darkest red, and places that were up to 9 degrees cooler than average are deep blue. Places, where the temperature was near average, are white. The gray areas over the poles indicate places where there are no ground-based observations.
Below the map is a graph of the May global temperature each year since 1880 compared to the 20th-century average. The globe as a whole hasn’t experienced a cooler-than-average (blue bars) May since 1976. According to NCEI’s Climate at a Glance tool, May temperatures have increased by 0.08˚Celsius (0.14˚Fahrenheit) over the period of observations.
For more May climate information, see the May 2021 State of the Climate summary from NCEI.
