“The water story for much of the American West over most of the past decade has been dominated by punishing drought. Reservoir levels have fallen to record or near-record lows, while groundwater tables have dropped dangerously in many areas. Now we’re preparing to see the flip side of nature’s water cycle — the arrival of steady, heavy rains and snowfall.” – Jet Propulsion Laboratory, CA climatologist Bill Patzert.
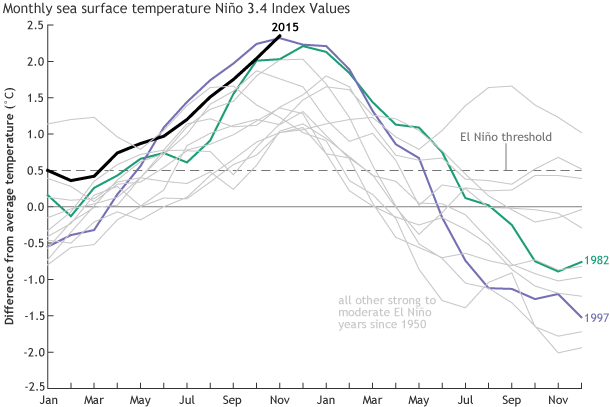
NASA just released this El Nino update. The current El Nino is in the running to be in the top 3 strongest El Nino’s on record.
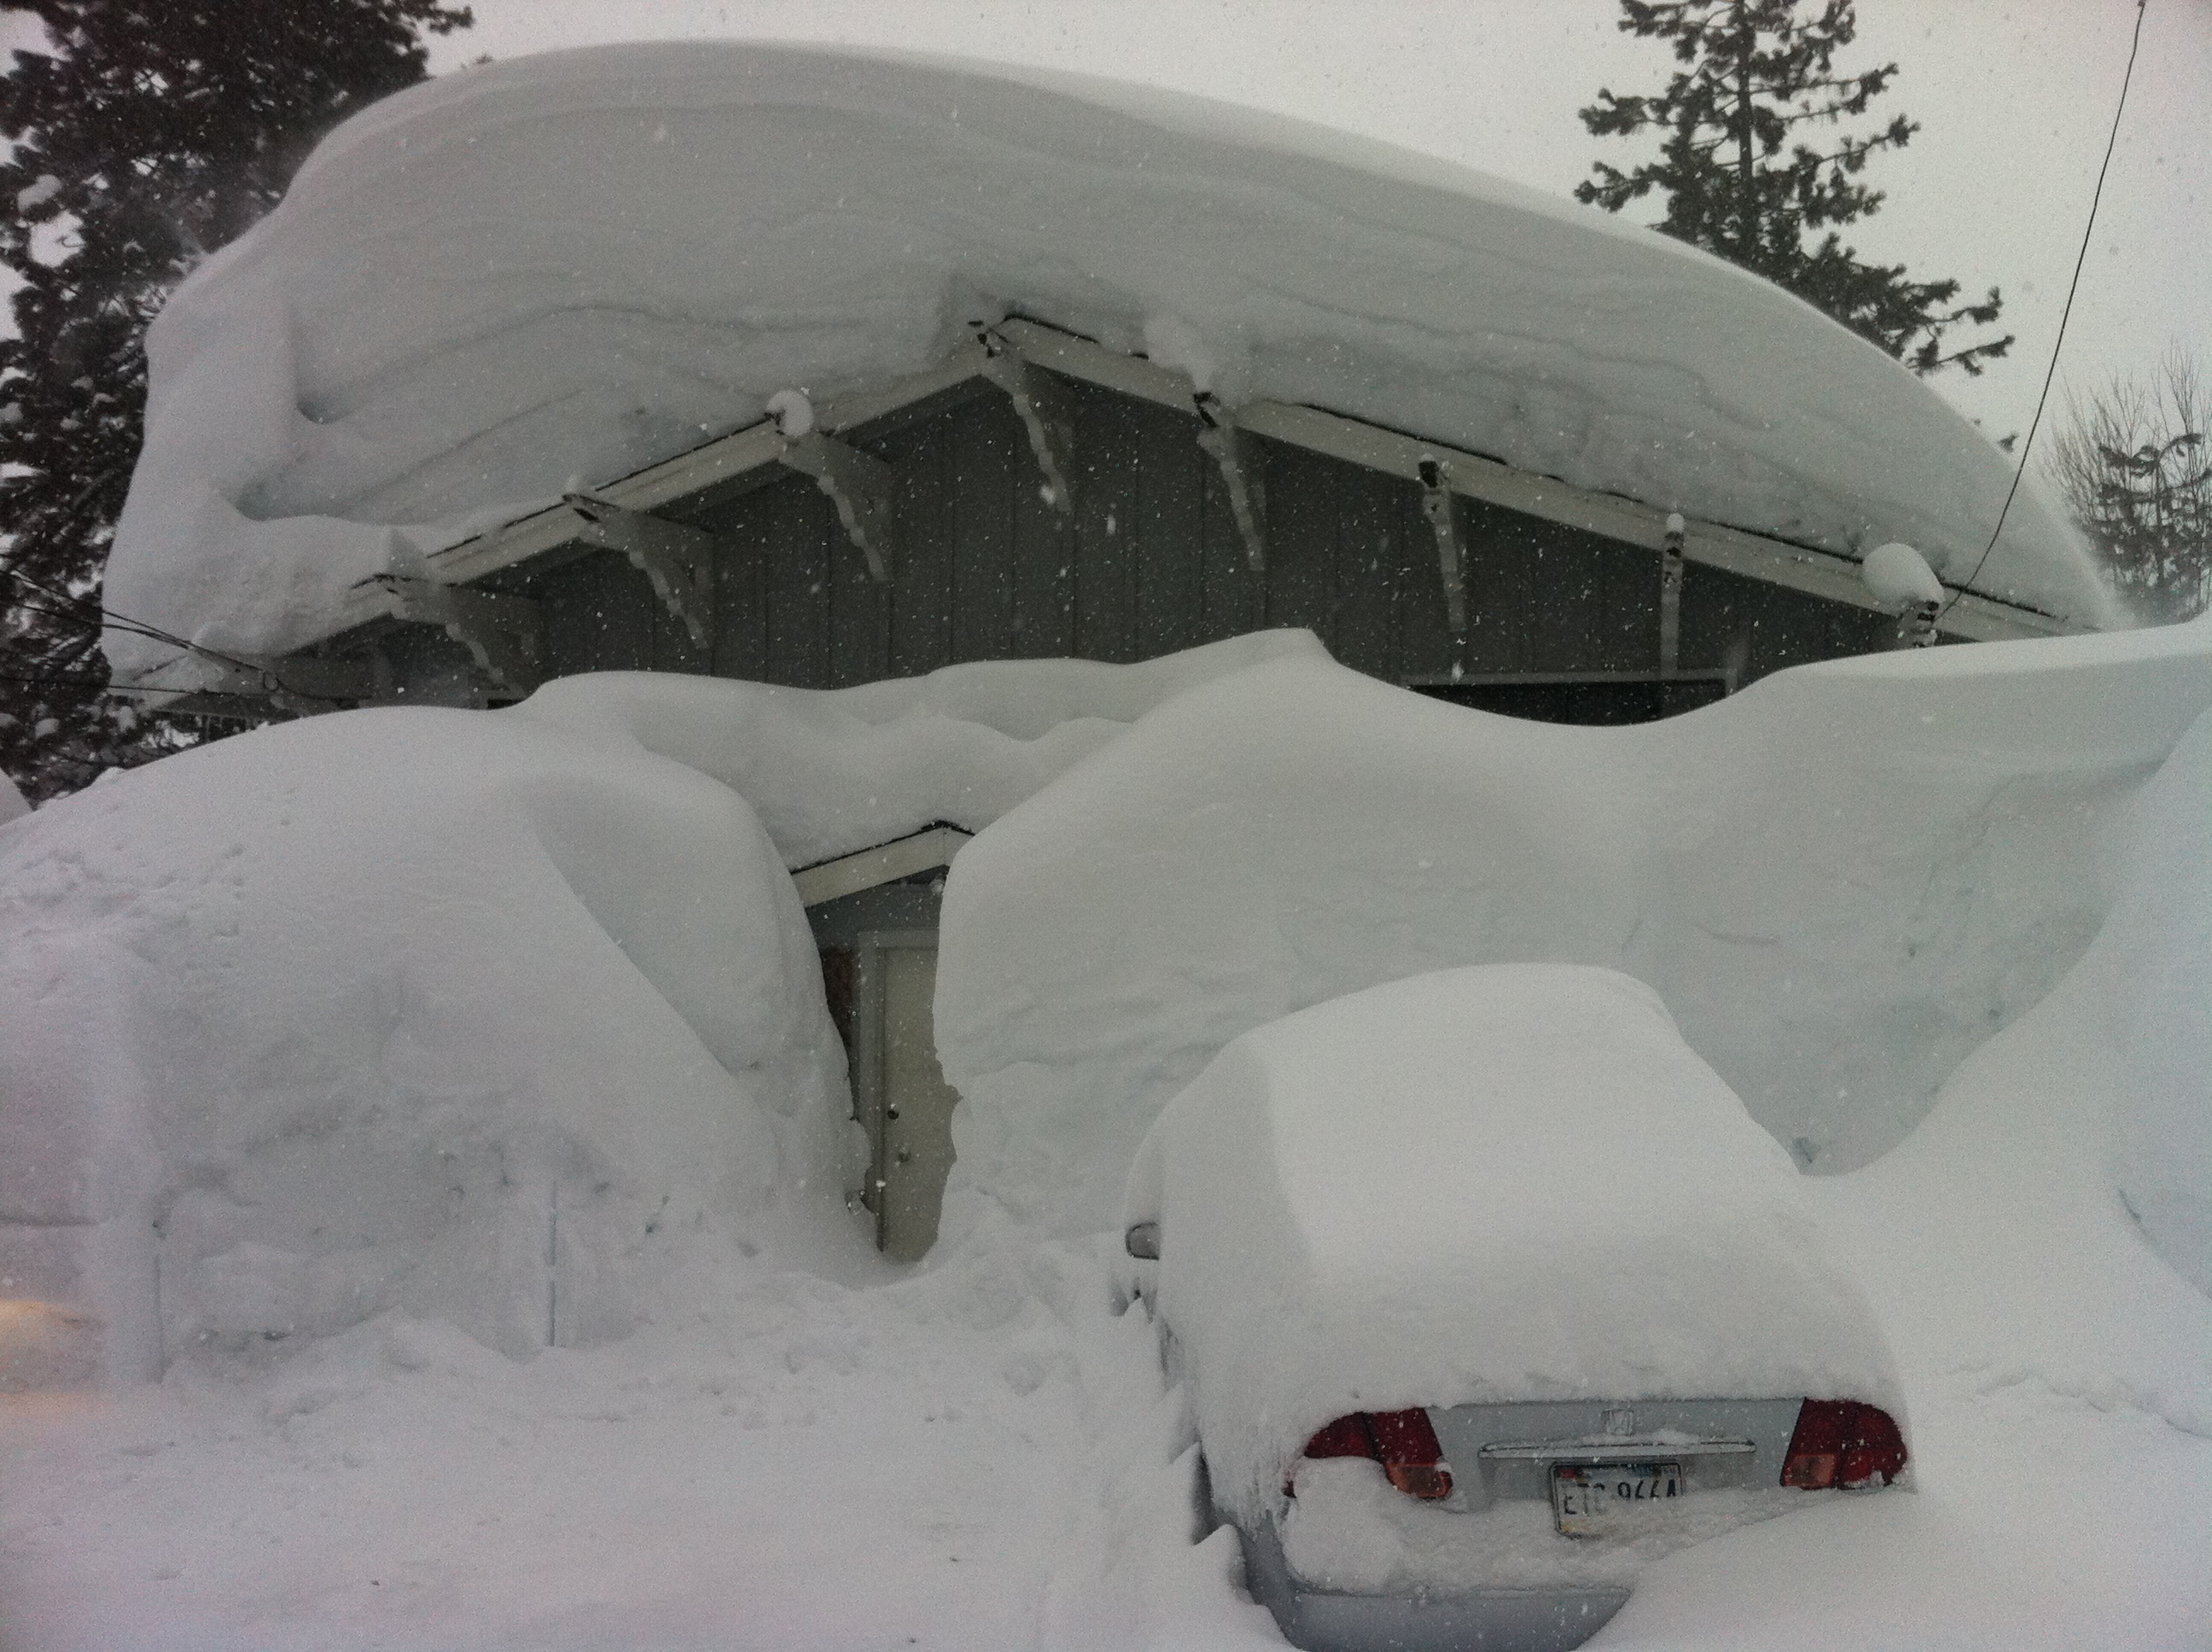
NASA is forecasting that La Nina will likely arrive for next winter. The last La Nina in 2011 brought record snowfall to the Western US and Canada.
Main Points of NASA’s El Nino Update:
- Current strong El Nino showing no signs of waning.
- El Nino 2015 has already caused weather chaos around the world.
- Current El Nino forecasted to have big impacts on USA next few months.
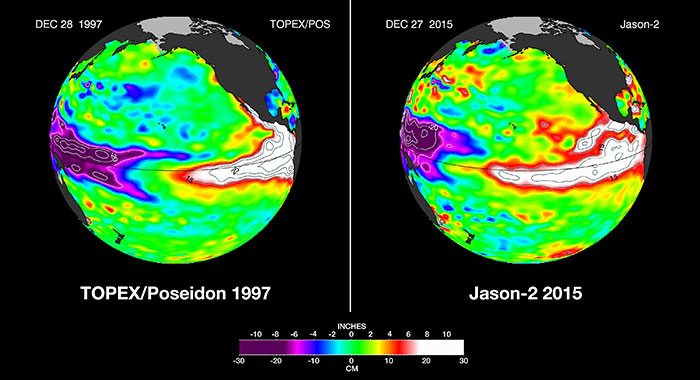
- Latest satellite images show current El Nino has striking resemblence to strongest El Nino ever recoreded, 1997, for same date of December 28th.
- Indonesia usually has a 20″ higher sea level than the West Coast of the USA. Right now, because of El Nino, they are level with each other.
- El Nino is being blamed right now for: Indian heat waves, delay in Indian monsoon rains, Pacific island sea level drops, widespread coral bleaching, droughts in South Africa, flooding in South America, record-breaking hurrican season in the eastern tropical Pacific, worldwide damage to rice, wheat, coffee, crops via droughts and floods leading to higher prices.La Nina likely next year. The last La Nina in 2011 brought record snowfall to the Western US and Canada.
A Still-Growing El Niño Set to Bear Down on US
by NASA
The current strong El Niño brewing in the Pacific Ocean shows no signs of waning, as seen in the latest satellite image from the U.S./European Ocean Surface Topography Mission (OSTM)/Jason-2 mission.
El Niño 2015 has already created weather chaos around the world. Over the next few months, forecasters expect the United States to feel its impacts as well.
The latest Jason-2 image bears a striking resemblance to one from December 1997, by Jason-2’s predecessor, the NASA/Centre National d’Etudes Spatiales (CNES) Topex/Poseidon mission, during the last large El Niño event. Both reflect the classic pattern of a fully developed El Niño.
The images show nearly identical, unusually high sea surface heights along the equator in the central and eastern Pacific: the signature of a big and powerful El Niño. Higher-than-normal sea surface heights are an indication that a thick layer of warm water is present.
El Niños are triggered when the steady, westward-blowing trade winds in the Pacific weaken or even reverse direction, triggering a dramatic warming of the upper ocean in the central and eastern tropical Pacific. Clouds and storms follow the warm water, pumping heat and moisture high into the overlying atmosphere. These changes alter jet stream paths and affect storm tracks all over the world.
This year’s El Niño has caused the warm water layer that is normally piled up around Australia and Indonesia to thin dramatically, while in the eastern tropical Pacific, the normally cool surface waters are blanketed with a thick layer of warm water. This massive redistribution of heat causes ocean temperatures to rise from the central Pacific to the Americas. It has sapped Southeast Asia’s rain in the process, reducing rainfall over Indonesia and contributing to the growth of massive wildfires that have blanketed the region in choking smoke.
El Niño is also implicated in Indian heat waves caused by delayed monsoon rains, as well as Pacific island sea level drops, widespread coral bleaching that is damaging coral reefs, droughts in South Africa, flooding in South America and a record-breaking hurricane season in the eastern tropical Pacific. Around the world, production of rice, wheat, coffee and other crops has been hit hard by droughts and floods, leading to higher prices.
In the United States, many of El Niño’s biggest impacts are expected in early 2016. Forecasters at the National Oceanic and Atmospheric Administration favor an El Niño-induced shift in weather patterns to begin in the near future, ushering in several months of relatively cool and wet conditions across the southern United States, and relatively warm and dry conditions over the northern United States.
While scientists still do not know precisely how the current El Niño will affect the United States, the last large El Niño in 1997-98 was a wild ride for most of the nation. The “Great Ice Storm” of January 1998 crippled northern New England and southeastern Canada, but overall, the northern tier of the United States experienced long periods of mild weather and meager snowfall. Meanwhile, across the southern United States, a steady convoy of storms slammed most of California, moved east into the Southwest, drenched Texas and — pumped up by the warm waters of the Gulf of Mexico — wreaked havoc along the Gulf Coast, particularly in Florida.
“In 2014, the current El Niño teased us — wavering off and on,” said Josh Willis, project scientist for the Jason missions at JPL. “But in early 2015, atmospheric conditions changed, and El Niño steadily expanded in the central and eastern Pacific. Although the sea surface height signal in 1997 was more intense and peaked in November of that year, in 2015, the area of high sea levels is larger. This could mean we have not yet seen the peak of this El Niño.”
During normal, non-El Niño conditions, the amount of warm water in the western equatorial Pacific is so large that sea levels are about 20 inches (50 centimeters) higher in the western Pacific than in the eastern Pacific. “You can see it in the latest Jason-2 image of the Pacific,” said Willis. “The 8-inch [20-centimeter] drop in the west, coupled with the 10-inch [25-centimeter] rise in the east, has completely wiped out the tilt in sea level we usually have along the equator.”
The new Jason-2 image shows that the amount of extra-warm surface water from the current El Niño (depicted in red and white shades) has continuously increased, especially in the eastern Pacific within 10 degrees latitude north and south of the equator. In the western Pacific, the area of low sea level (blue and purple) has decreased somewhat from late October. The white and red areas indicate unusual patterns of heat storage. In the white areas, the sea surface is between 6 and 10 inches (15 to 25 centimeters) above normal, while in the red areas, it is about 4 inches (10 centimeters) above normal. The green areas indicate normal conditions. The height of the ocean water relates, in part, to its temperature, and is an indicator of the amount of heat stored in the ocean below.
Within this area, surface temperatures are greater than 86 degrees Fahrenheit (30 degrees Celsius) in the central equatorial Pacific and near 70 degrees Fahrenheit (21 degrees Celsius) off the coast of the Americas. This El Niño signal encompasses a surface area of 6 million square miles (16 million square kilometers) — more than twice as big as the continental United States.
While no one can predict the exact timing or intensity of U.S. El Niño impacts, for drought-stricken California and the U.S. West, it’s expected to bring some relief.
“The water story for much of the American West over most of the past decade has been dominated by punishing drought,” said JPL climatologist Bill Patzert. “Reservoir levels have fallen to record or near-record lows, while groundwater tables have dropped dangerously in many areas. Now we’re preparing to see the flip side of nature’s water cycle — the arrival of steady, heavy rains and snowfall.”
In 1982-83 and 1997-98, large El Niños delivered about twice the average amount of rainfall to Southern California, along with mudslides, floods, high winds, lightning strikes and high surf. But Patzert cautioned that El Niño events are not drought busters. “Over the long haul, big El Niños are infrequent and supply only seven percent of California’s water,” he said.
“Looking ahead to summer, we might not be celebrating the demise of this El Niño,” cautioned Patzert. “It could be followed by a La Niña, which could bring roughly opposite effects to the world’s weather.”
La Niñas are essentially the opposite of El Niño conditions. During a La Niña episode, trade winds are stronger than normal, and the cold water that normally exists along the coast of South America extends to the central equatorial Pacific. La Niña episodes change global weather patterns and are associated with less moisture in the air over cooler ocean waters. This results in less rain along the coasts of North and South America and along the central and eastern equatorial Pacific, and more rain in the far Western Pacific.
El Niño events are part of the long-term, evolving state of global climate, for which measurements of sea surface height are a key indicator.