When it comes to mountain snowpack, the Sierra Nevada is notorious for booms and busts: One year is bad, while another can be exceedingly good. In 2021-22, there were booms and busts all within the same snow season. The result has been another year of inadequate snowfall and concerns about the impact on water supplies.
“The Sierras tend to get big storms, with a lot of snow in bursts, or we get years of very little snow. It is rare that we have a snow year that is actually average.”
– Noah Molotch, a mountain hydrologist at the Institute of Arctic and Alpine Research (INSTAAR) and NASA’s Jet Propulsion Laboratory
Snow that falls on the Sierra Nevada each winter becomes a natural reservoir that slowly melts and flows down into the river valleys in spring and summer. In a typical year, this snowpack accounts for about 30 percent of California’s water supply. Resource managers count on this snowmelt to fill reservoirs with sufficient water for the typically dry months of summer and autumn.
“This past winter was one of extremes within an overall downward trend. These are natural events that could normally happen, but global warming has amplified everything. The trajectory of climate change has put us on a path where the normal wild swings of winter are now warp-drive wild.”
– Noah Molotch
The see-saw pattern of rain and snowfall along the western coast of North America is sometimes connected to El Niño and La Niña patterns—which alter atmospheric circulation in the tropics and mid-latitudes—and to the atmospheric rivers that occasionally funnel bursts of moisture toward California from the tropical Pacific. The past few years have brought persistent La Niña conditions in the tropical Pacific that tend to make some regions drier. At the same time, ever-warming global temperatures and changing jet streams have brought more frequent clear and dry weather to the mountains.
The result is a significantly diminished snowpack in 2022. The deficit is apparent in the snow water equivalent (SWE) for the Sierra Nevada, a measurement of how much water you would get if all of the snow in a given area melted at once. According to the California Department of Water Resources (CA-DWR), Sierra Nevada SWE on April 1 stood at just 37 percent of the long-term average.
After a dry November start to the snow season, December 2021 brought 70 percent of the average annual snowfall in just one month. The snow water equivalent on December 30 was calculated by CA-DWR to be 160 percent of normal. But then the flow was shut off, as the region endured its driest January-February-March period on record and unusually warm temperatures. A March 2022 heatwave then melted snow prematurely, and dry conditions continued into mid-April before several late-season storms gave the mountain snowpack a short-lived boost. By May 5, 2022, CA-DWR reported Sierra-wide snow water equivalents were back down to 27 percent of normal.
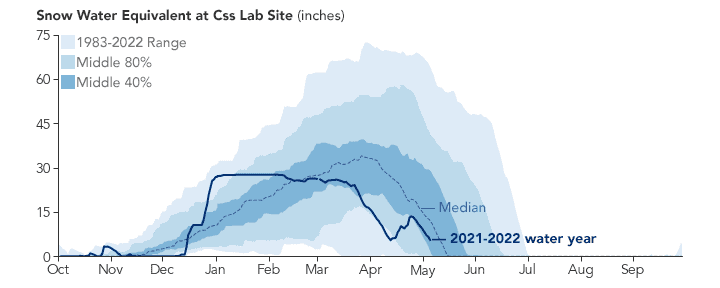
The line graph above shows the boom-and-bust pattern as observed at Donner Pass, site of the Central Sierra Snow Lab (CSS Lab), one of the oldest snow-measurement operations in the mountain range. The peak snow water equivalent across the 39-year record (dashed line) usually occurs around March 24, with a median at 37.2 inches. In 2022, SWE peaked at 27.6 inches on January 12 and started falling on February 6. The data in the graph come from the SNOTEL network, which is managed by the U.S. Department of Agriculture. In California, several water, research, and power institutions track the ebb and flow of mountain snow.
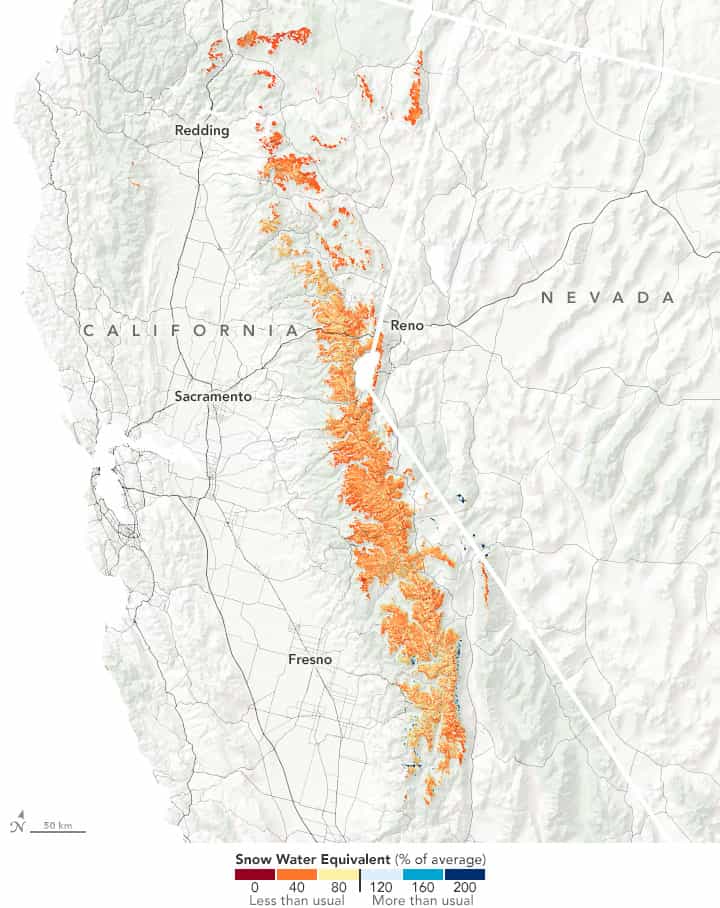
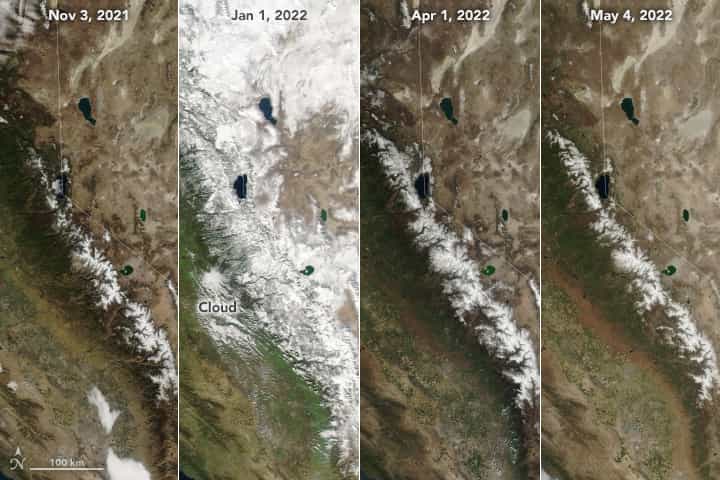
Natural-color satellite images (below) can broadly show the progress of the snow season and help scientists assess the extent of snow cover. But they offer little about snow depth. And while SNOTEL and other monitoring networks offer some of the longest daily records of snow depths and water content over the past four decades, the measurements come from individual locations and mostly within a narrow elevation range.
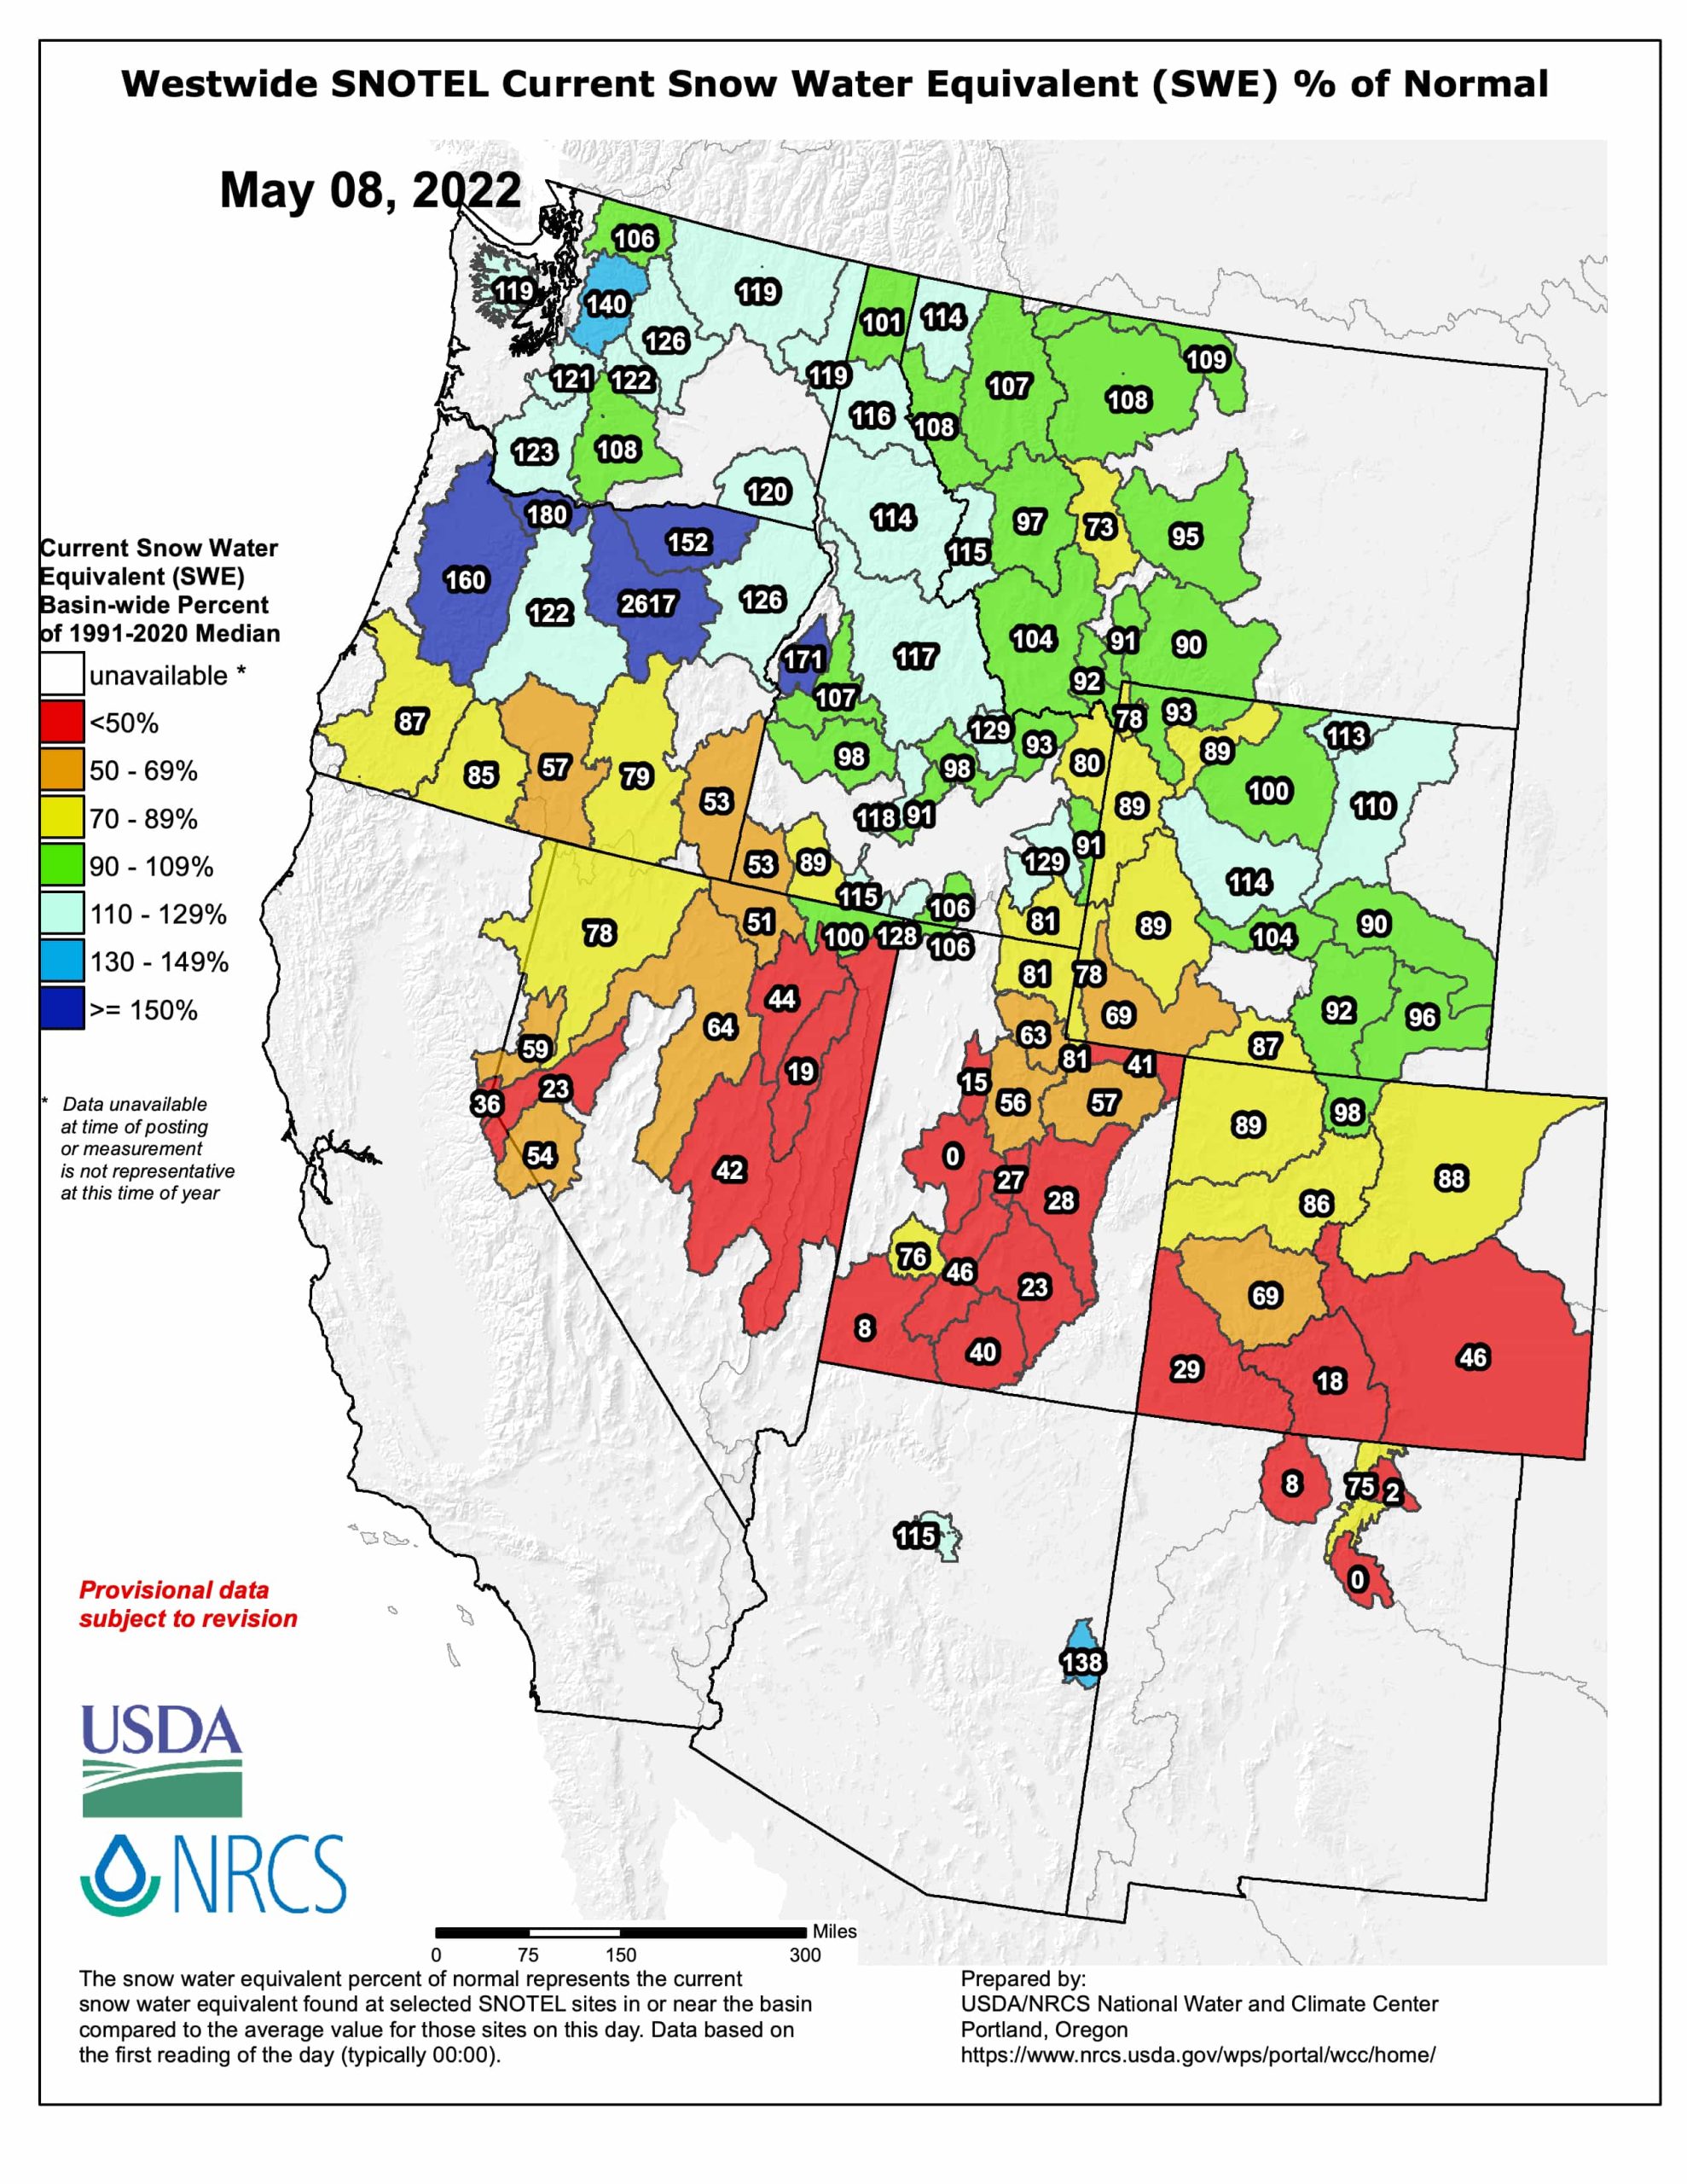
To fill in the gaps in what we know about snow water at higher elevations and across wider geographic areas, researchers have been developing tools to extrapolate and interpolate the snowpack. The map at the top of this page is one such effort.
Based on data provided by Molotch and INSTAAR colleagues Leanne Lestak and Kehan Yang, the experimental product depicts snow water equivalents on April 24, 2022, and how they compare to the long-term average for the mountain range. The estimates of SWE are derived from a combination of 20 years of NASA satellite data, the SNOTEL record, topographic information, and computer modeling. Seed funding for the product was originally provided by NASA’s applied sciences program, and it is now supported by CA-DWR.
As of INSTAAR’s April 24 report, the percent of average SWE above 5,000 feet elevation was highest in the central region of the Sierra Nevada (61 percent), then the north (47 percent), and lowest in the south (41 percent). Just one week later, those numbers dropped to 42 percent in the central Sierra, 33 percent in the south, and 26 percent in the north.
“Our natural water tower is becoming leaky. If snow is melting earlier, that means water is coming out of our natural mountain reservoir earlier. This also means we have to manage it downstream when we might not have the flexibility that we would like.”
“The extreme precipitation events that can do a great job building snowpack—such as occurred last December—are going to become less beneficial, as we will likely have more rain falling instead of snow. Warming and drying will lead to more snow-free days, and snow will start melting out earlier. As this climatology continues to shift, how will the surface and the groundwater hydrology respond to the low snow conditions, the singular extreme years, and the back-to-back dry years? We really need a better set of observational tools and modeling systems from the atmosphere to the bedrock to understand these changes.”
– Benjamin Hatchett, a hydroclimatologist at the Desert Research Institute who studies snow droughts. He is a strong skier and friend of SnowBrains.
This post first appeared on NASA Earth Observatory and was written by Michael Carlowicz. NASA Earth Observatory images by Joshua Stevens and Lauren Dauphin, using data courtesy of Leanne Lestak/University of Colorado-INSTAAR, the USDA Natural Resources Conservation Service, and MODIS data from NASA EOSDIS LANCE and GIBS/Worldview.