NOAA Press Release:
EL NIÑO/SOUTHERN OSCILLATION (ENSO) DIAGNOSTIC
DISCUSSION
Issued By:
CLIMATE PREDICTION CENTER/NCEP/NWS
and the International Research Institute for Climate and Society
13 December 2018
ENSO Alert System Status: El Niño Watch
Synopsis:
El Niño is expected to form and continue through the Northern Hemisphere winter 2018-
19 (~90% chance) and through spring (~60% chance).
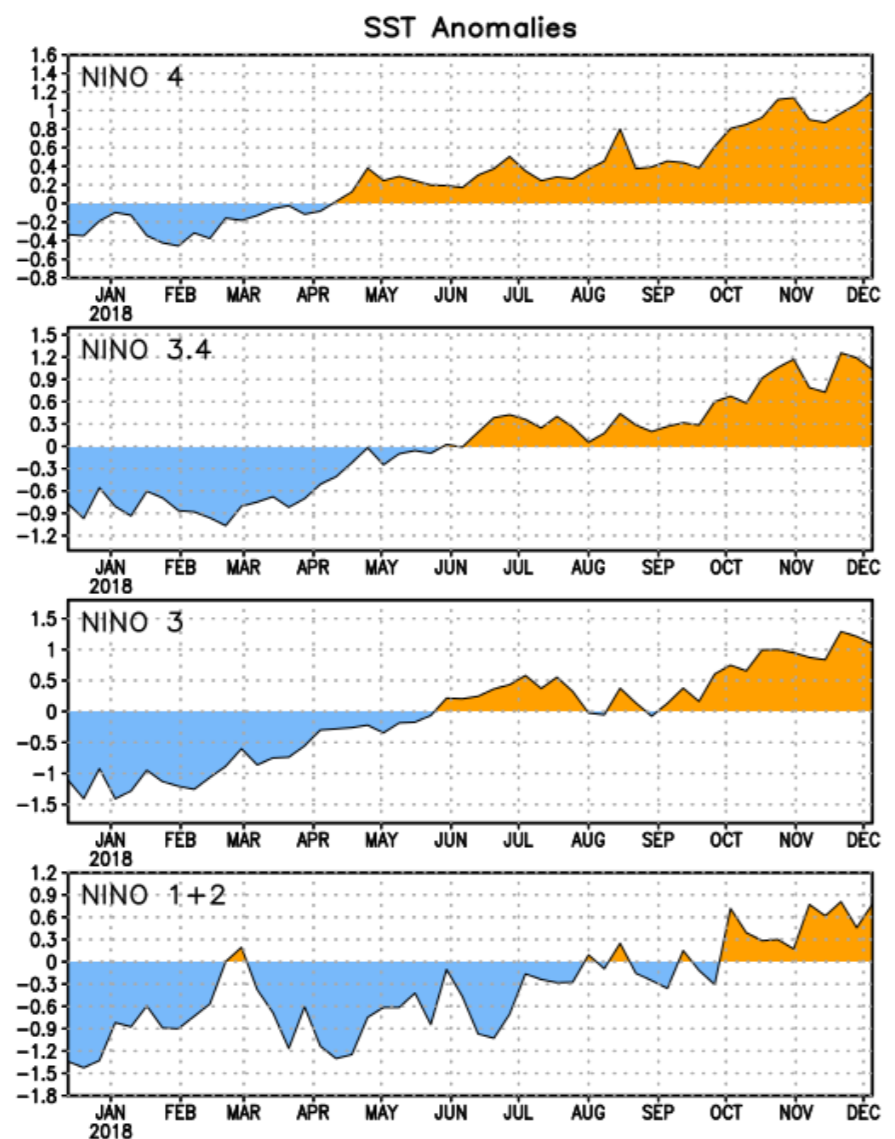
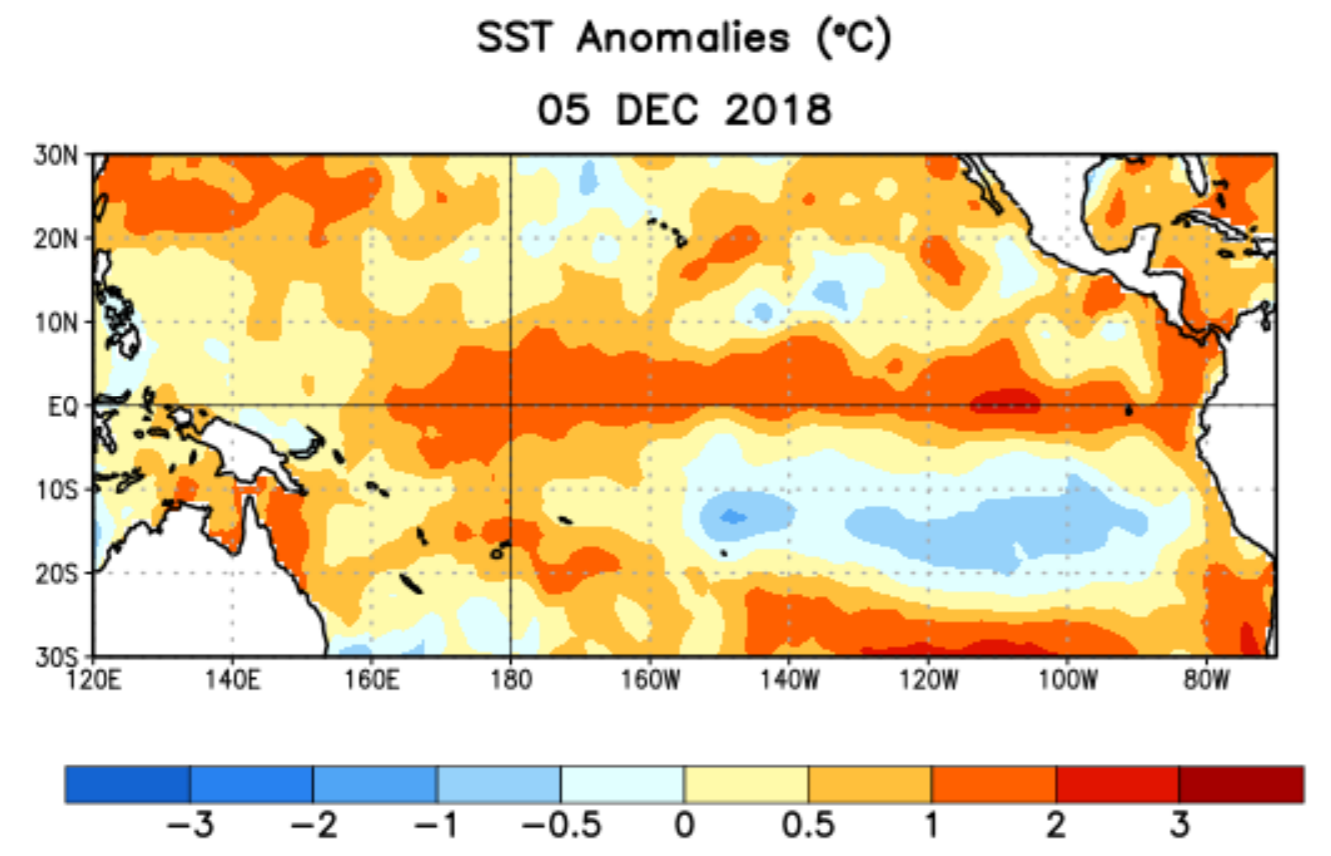
surface temperatures (SSTs) across the equatorial Pacific Ocean (Fig. 1). The latest weekly SST indices
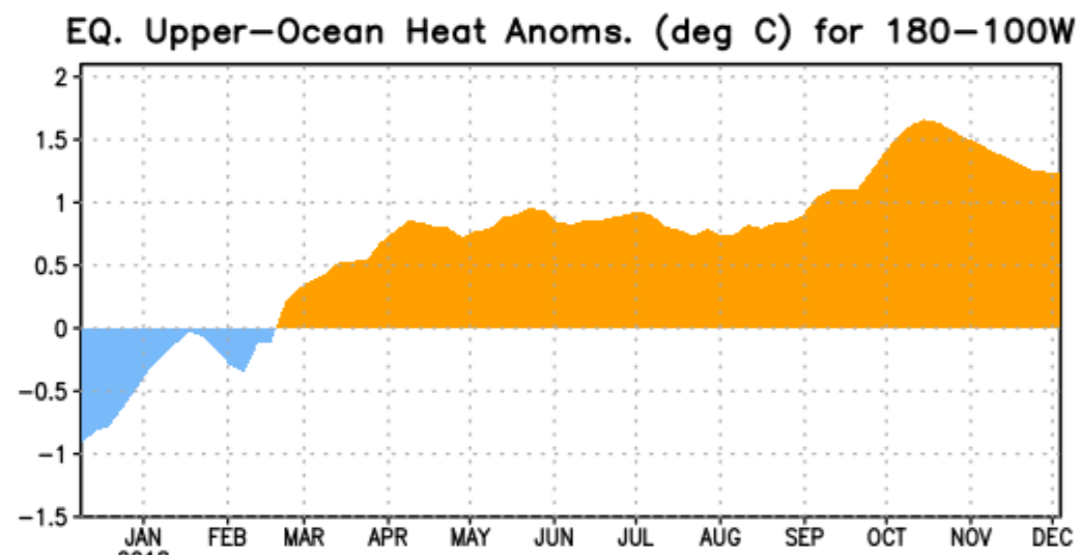
for all four Niño regions were near +1.0C (Fig. 2). Positive subsurface temperature anomalies (averaged
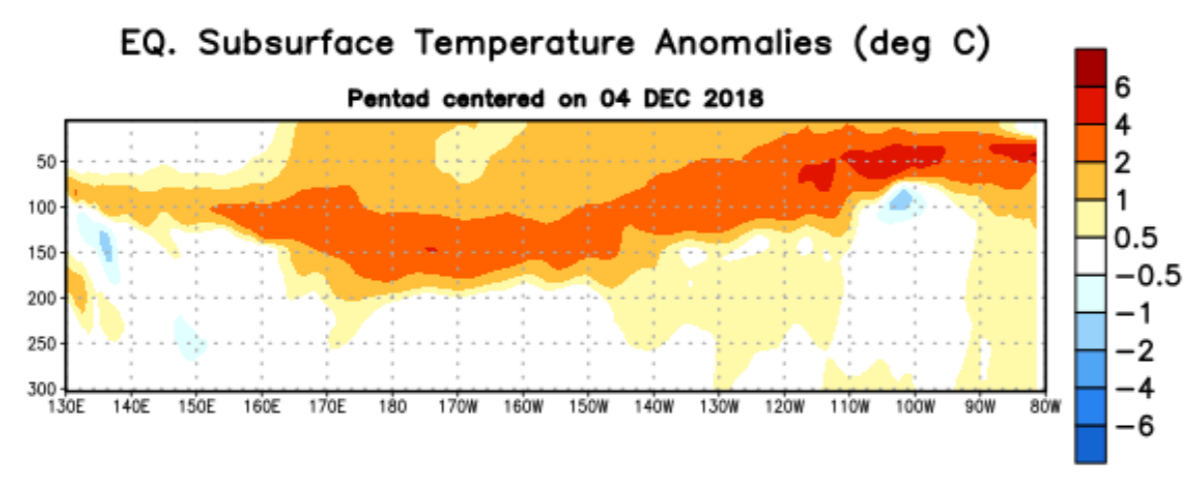
across 180°-100°W) weakened slightly (Fig. 3), but above-average temperatures persist at depth across
the central and eastern equatorial Pacific Ocean (Fig. 4). However, the atmospheric anomalies largely
reflected intra-seasonal variability related to the Madden-Julian Oscillation, and have not yet shown a
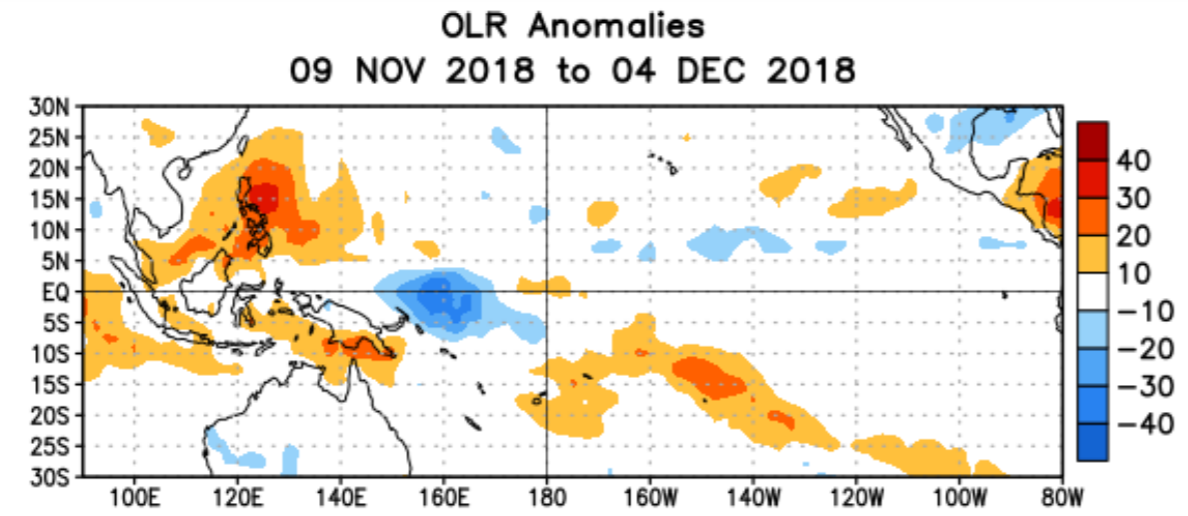
clear coupling to the above-average ocean temperatures. For the month as a whole, atmospheric
convection remained close to average near the Date Line and suppressed over Indonesia (Fig. 5). Also,
the low-level and upper level winds were mostly near average across the equatorial Pacific. The
equatorial Southern Oscillation index (SOI) was negative, while the traditional SOI was near zero.
Despite the above-average ocean temperatures, the overall coupled ocean-atmosphere system remained ENSO-neutral.
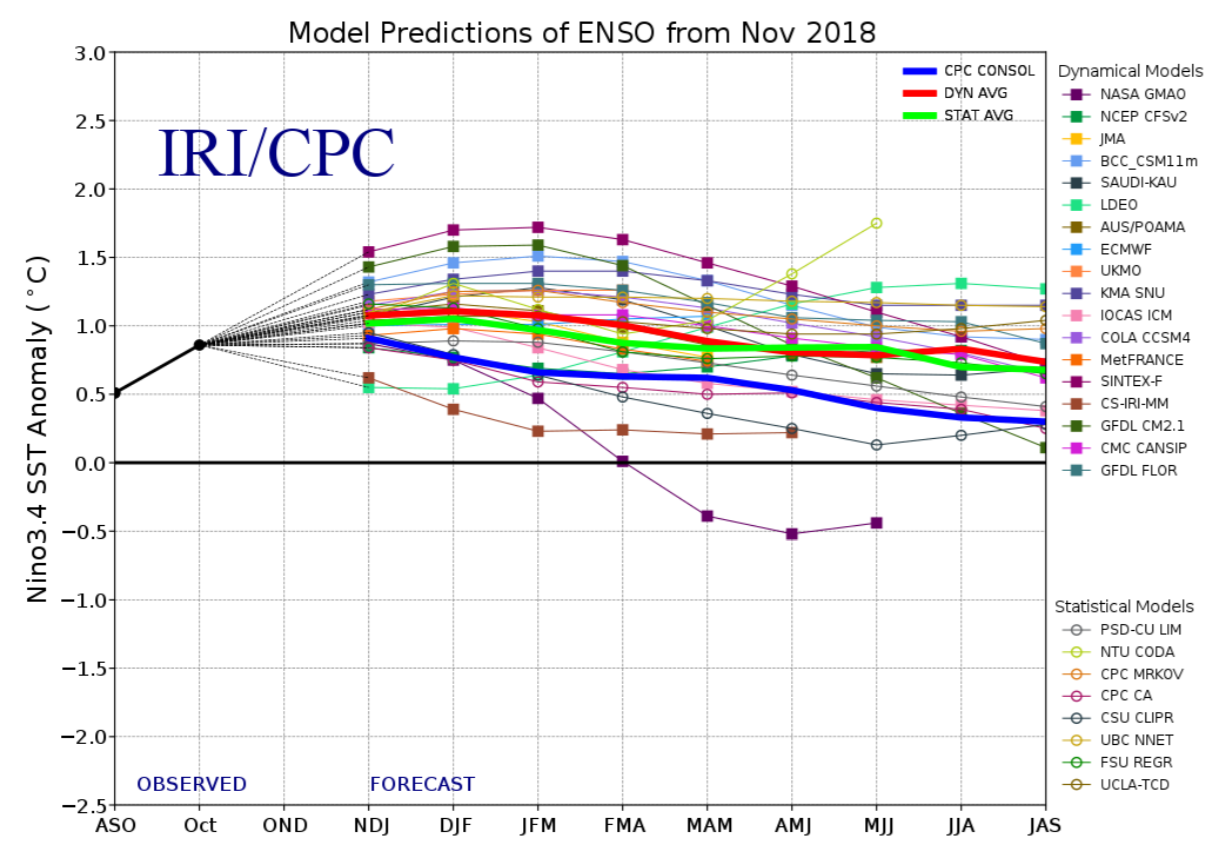
The majority of models in the IRI/CPC plume predict a Niño3.4 index of +0.5C or greater to
continue through the winter and spring (Fig. 6). The official forecast favors the formation of a weak El
Niño, with the expectation that the atmospheric circulation will eventually couple to the anomalous
equatorial Pacific warmth. In summary, El Niño is expected to form and continue through the Northern
Hemisphere winter 2018-19 (~90% chance) and spring (~60% chance; click CPC/IRI consensus forecast
for the chance of each outcome for each 3-month period).
This discussion is a consolidated effort of the National Oceanic and Atmospheric Administration
(NOAA), NOAA’s National Weather Service, and their funded institutions. Oceanic and atmospheric
conditions are updated weekly on the Climate Prediction Center web site (El Niño/La Niña Current
Conditions and Expert Discussions). Forecasts are also updated monthly in the Forecast Forum of CPC’s Climate Diagnostics Bulletin. Additional perspectives and analysis are also available in an ENSO blog.
The next ENSO Diagnostics Discussion is scheduled for 10 January 2019. To receive an e-mail
notification when the monthly ENSO Diagnostic Discussions are released, please send an e-mail message to: ncep.list.enso-update@noaa.gov.