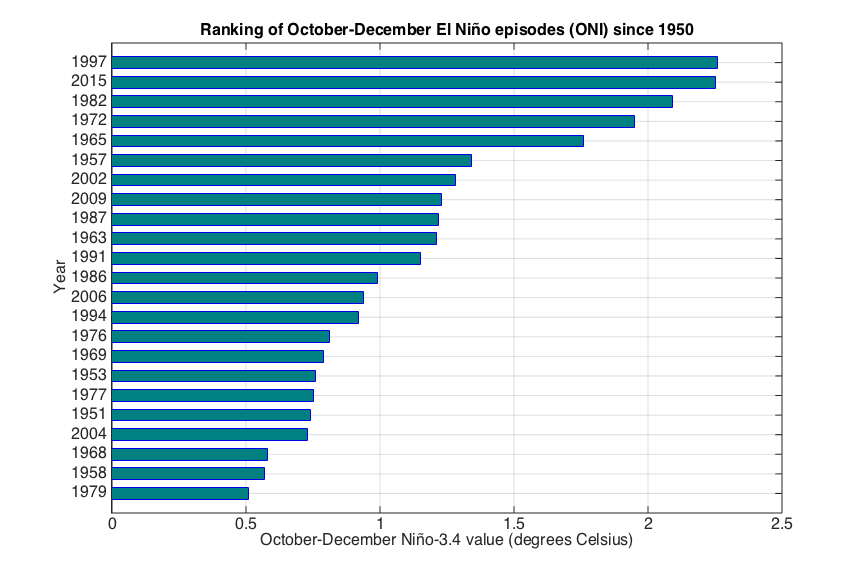
NOAA is reporting today that the current El Nino is tied with the strongest El Nino on record (1997). This is based on the 3-month mean sea surface temperature anomaly for the Nino 3.4 region from Oct-Dec.
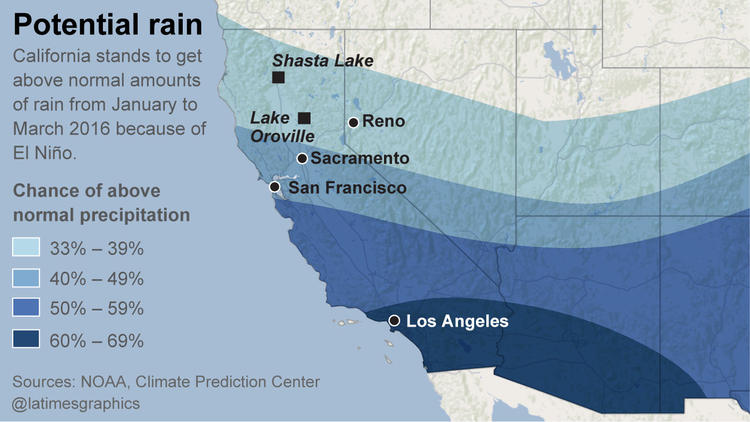
It’s widely thought that the current Strong El Nino will bring storm after storm to California:
This year’s El Nino will mean “mudslides, heavy rainfall, one storm after another like a conveyor belt.” – Bill Patzert, climatologist for NASA’s Jet Propulsion Laboratory in La Cañada, CA
“January and February are just around the corner. If you think you should make preparations, get off the couch and do it now. These storms are imminent,El Niño is here. And it is huge.” – Bill Patzert, climatologist for NASA’s Jet Propulsion Laboratory in La Cañada told the LA Times
Learn More about the current El Nino:
2015 El Nino
“Current El Niño ties 1997-98, NOAA Reports
New, preliminary number released today shows current El Niño is tied with 1997-98 El Niño as the strongest on record (at 2.3°C above normal) when based on the 3-month mean sea surface temperature anomaly for the Niño 3.4 region. NOAA updated its Oceanic Niño Index (ONI) value for Oct. – Dec., which is one method to identify El Niño/Southern Oscillation (ENSO) events in the tropical Pacific. The next ENSO forecast will be issued January 14.” – NOAA, today