
Is El Nino AWOL? Is El Nino Missing??
It’s been dry this month… really dry…
It’s no secret that the storms have basically stopped for the entire month of February. California saw only one storm in February while the rest of the month has been nothing but sun and record temperatures. Yesterday, valley locations in CA saw over 80ºF and Squaw Valley is forecast to be over 60ºF today…
The Western USA in general has been dry most all of February and we don’t even want to get started on the East Coast. El Nino hates the East Coast this year…
Forecasts are looking very dry in US Ski Country the rest of this month…
Is El Niño AWOL?
by Michelle L’Heureux/NOAA
Is El Niño missing? What happened to the rainfall I was promised? What is going on? Some quick answers for those who don’t want to read it all (but then you’ll miss the graphical awesomeness I coded up with an assist from climate.gov staff. So read to the end. Please.):
I. No. It’s still here. Based on measurements of sea surface temperature in the tropical Pacific Ocean, this El Niño is the biggest event we’ve seen in almost twenty years.
II. NOAA CPC climate forecasters don’t promise precipitation. For some regions of the U.S., we provide seasonal outlooks for an increased chance of precipitation over a span of a 3-month (seasonal) average.
III. I really don’t know. I ask myself this all the time (particularly during election years).
Here, I’m going to present some recent observations and show how they compare to a typical El Niño pattern. Hopefully you’ll walk away with a couple impressions. The maps below are of the atmospheric flow (1) and precipitation anomalies, or departures, from the December & January average during El Niño (2). Keep in mind no single year ever perfectly matches the “normal” El Niño pattern (3). But how well is the pattern matching up so far this winter?
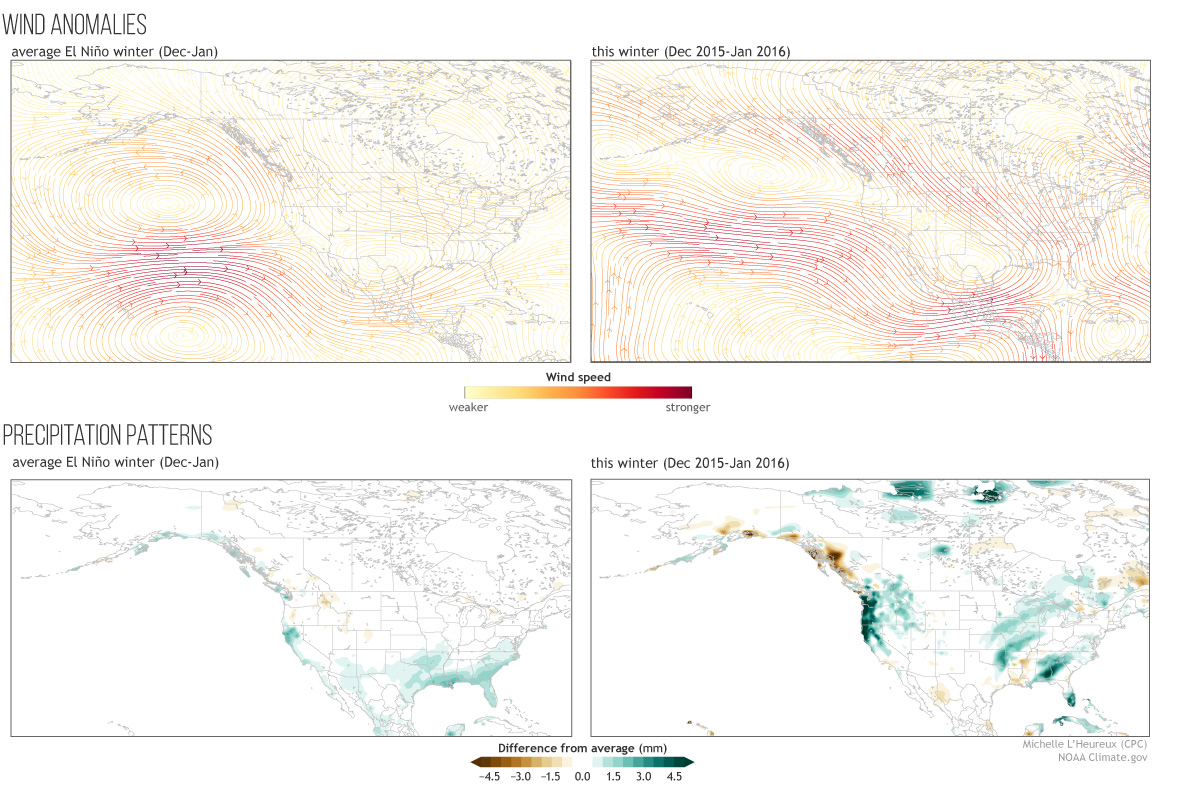
(top left) Reconstruction of El Niño wind anomalies during December and January. (top right) The average wind anomaly from December 2015 and January 2016. (bottom left) Reconstruction of El Niño precipitation anomalies during December and January. (bottom right) The average precipitation anomaly from December 2015 and January 2016. The 250mb winds are from the NCEP/NCAR Reanalysis. Precipitation is from the CPC Unified precipitation (Chen et al., 2008). The dataset is station based, so areas with sparse observing networks will not show anomalies or will show a roughly concentric anomaly around a station (this is the case over large regions of Canada). Anomalies are calculated by subtracting the 1981-2010 monthly averages. Image by Michelle L’Heureux and NOAA Climate.gov.
The warmth in the tropical Pacific related to El Niño fuels a more southward-shifted, eastward-extended Pacific jet stream. You can see this feature in the upper left panel above, which shows strong, anomalous winds flowing from west-to-east over the North Pacific Ocean. The jet helps to drive moisture and precipitation into California. For the December 2015 and January 2016 average (top right panel), we also can see an eastward expansion of the Pacific jet stream and wetter conditions prevailed over the northern half of California and the Pacific Northwest (Tom also wrote about January’s wet weather).
El Niño is also linked to anomalous winds that extend from Central America to Florida and is linked to increased stormy weather and precipitation over the Gulf Coast and Florida. So far this winter, we see a similar flow pattern with wetter conditions over portions of the Southeast and an uptick in tornadoes over Florida.
Impression #1: Though this year’s impacts do not perfectly mirror the typical pattern, we’re already seeing El Niño’s thumbprints. But he’s like the temperamental kid in art class who can’t quite stay in between the lines with his finger paint. Part of that is because there are other weather and climate patterns, which provide distractions. At a given time, El Niño is never the only influence on the atmosphere, but it is the most predictable, which is why we like to talk about it.
Though the Pacific jet stream is juiced up and roaring this year, it is shifted slightly north of its typical position. Likewise, the wetter-than-average West Coast signal has expanded northward into the Pacific Northwest as well. This brings us to Impression #2: The details matter. Even subtle changes in the overall circulation can result in noticeable impacts. It is difficult to anticipate some of these shifts well in advance (4).
While El Niño is generally best seen in averages across 3-months (seasons), month-to-month variations can be significant (5). Again, there can be other things going on in the atmosphere, which can override El Niño. After all, El Niño doesn’t mean the jet stays locked in the exact same place all winter and spring, just that it tends to return to a particular location more frequently than usual. For example, in the figures below, the jet shifted north during December when it just so happened that we simultaneously saw a very positive Arctic Oscillation (AO) state, which might have contributed to this movement. Then in January, the jet shifted back southward, more closely resembling the typical El Niño pattern.
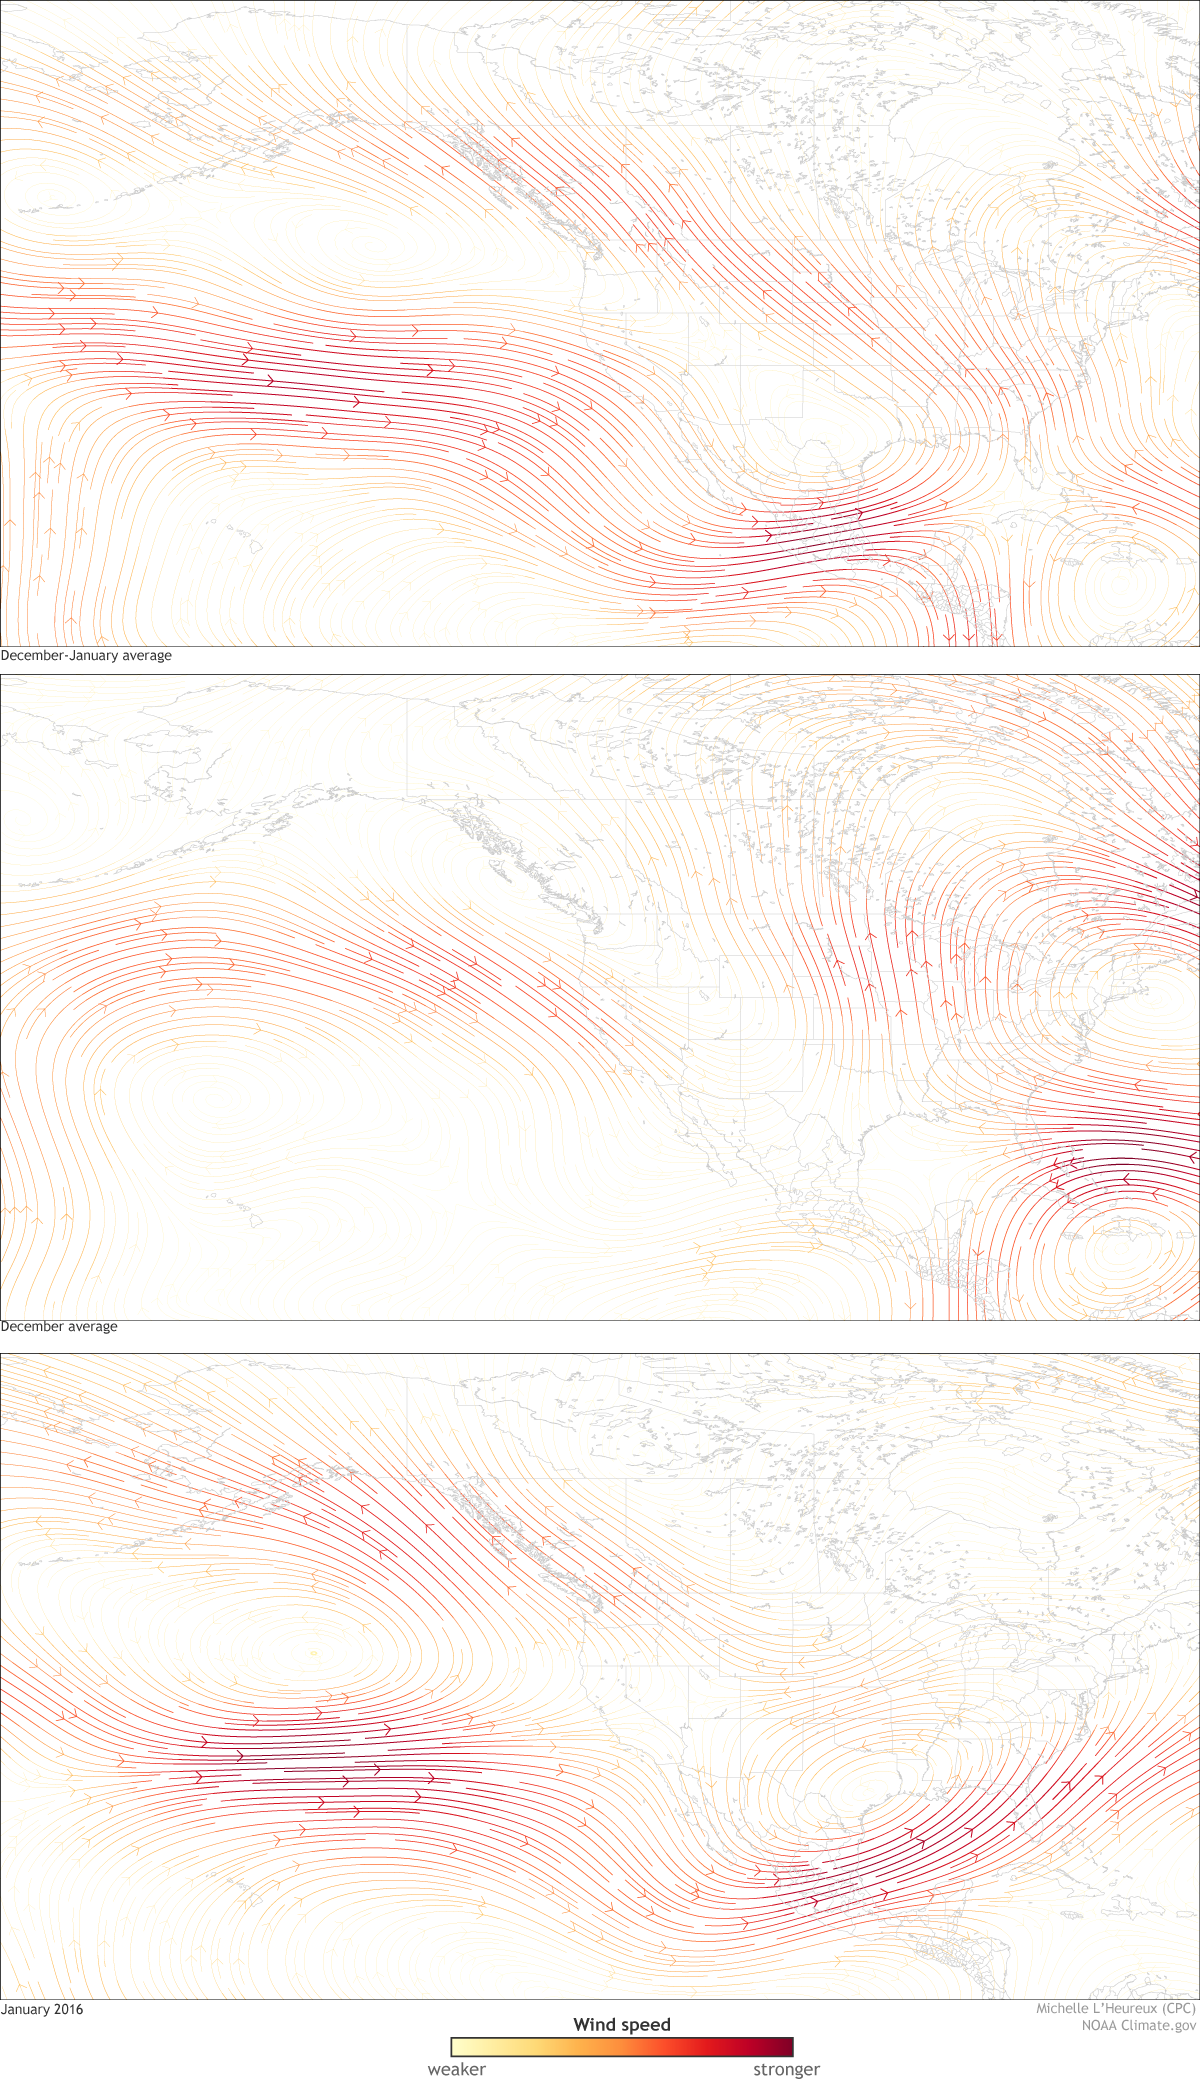
(top) Wind anomalies based on averaging December 2015 and January 2016. (middle) The wind anomaly from December 2015. (bottom) The wind anomaly from January 2016. The 250mb winds are from the NCEP/NCAR Reanalysis. Image by Michelle L’Heureux and NOAA Climate.gov.
These unpredictable details, like the AO, are why CPC climate forecasters provide the odds (probabilities) for certain impacts, and they are never 100% over the U.S. For example, this fall, forecasters indicated there would be a 60% chance of increased precipitation over southernCalifornia during the winter due to the knowledge there would be a strong, potentially historic El Niño. A reliable probability forecast means that, for similar outlooks over a long record, 6 out of 10 years should end up wetter and 4 out of 10 years should be near average or drier (click further to learn how to interpret and grade probabilities).
All in all, El Niño is enthusiastically reporting to work, even if its impacts are not identical to the “normal” pattern, and will exert an influence through the spring (March-April-May). It has peaked by most atmospheric and oceanic measures, but it will continue to push the circulation around not only over North America, but also across the globe.
Good job this winter on weather data. Killington Vermont worst winter ever. Monarch Colorado excellent winter.