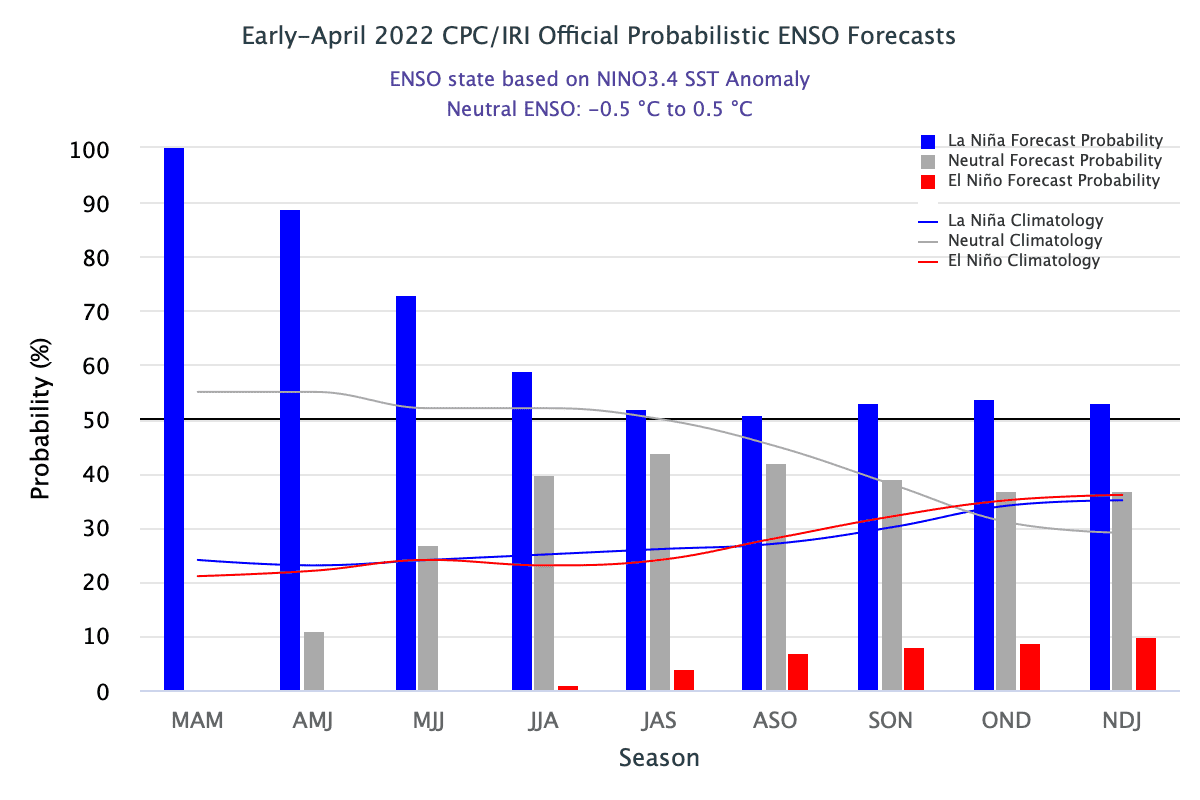
La Niña continues in the tropical Pacific, with both the ocean and atmosphere clearly reflecting La Niña conditions. The current forecast favors the continuation of La Niña through the summer (59% chance), with a slightly lower chance into the fall (50-55% chance). A third-year La Niña would be pretty unusual—we’ve only seen two others since 1950. I’ll run the numbers to see how current conditions add up and what’s factoring into the odds for La Niña later this year.
Paint by numbers
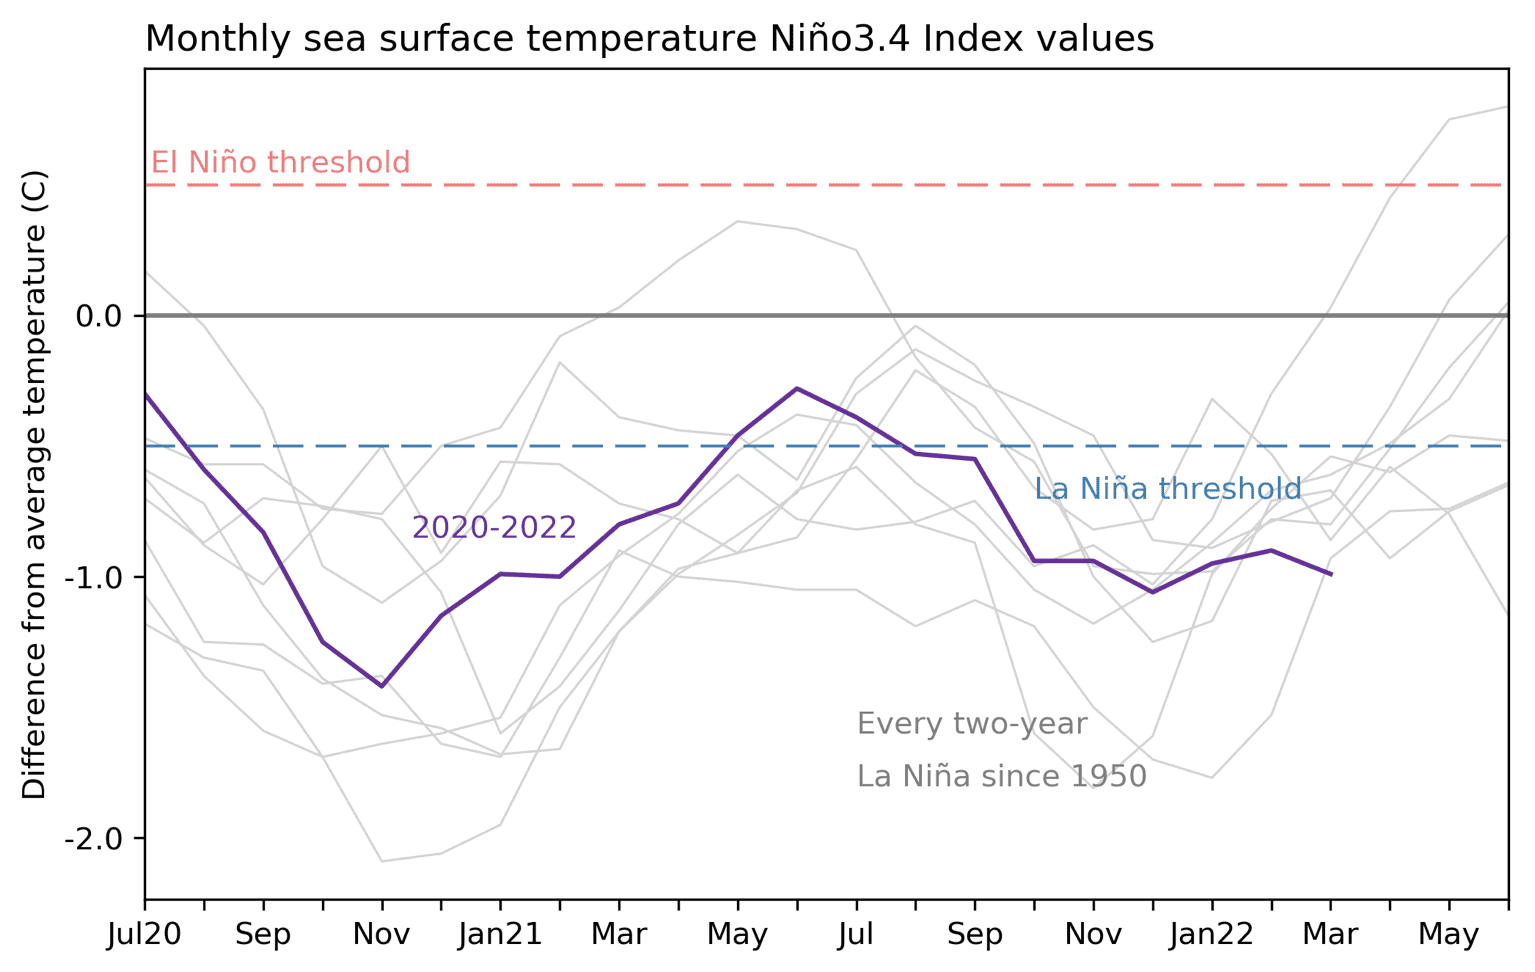
Let’s take stock of current ENSO conditions (ENSO=El Niño/Southern Oscillation, the whole ocean-atmosphere El Niño/La Niña system) in the tropical Pacific. In March, the sea surface temperature in the key ENSO monitoring region (Niño-3.4) was still well within the La Niña range, about 1.0 °C cooler than the long-term (1991-2020) average, based our most reliable historical record, ERSSTv5. Remember: the La Niña threshold is a temperature anomaly—a difference from the long-term average—in the Niño-3.4 region of -0.5 °C or lower. March 2022 was the 6th most negative March sea surface temperature anomaly in Niño-3.4 since 1950.
As you can see from the graph, March 2022 was also tied for the coldest of the nine second-year La Niña events on record, for this time of year.
One plus one
While the ocean surface temperature confidently indicates that La Niña is still going strong, it’s not unusual for this time of year, and wouldn’t necessarily tell us much about how long this La Niña might last. Things start to get interesting when we look at the atmosphere, though, providing a bit more insight into why forecasters are favoring La Niña to continue through the summer.
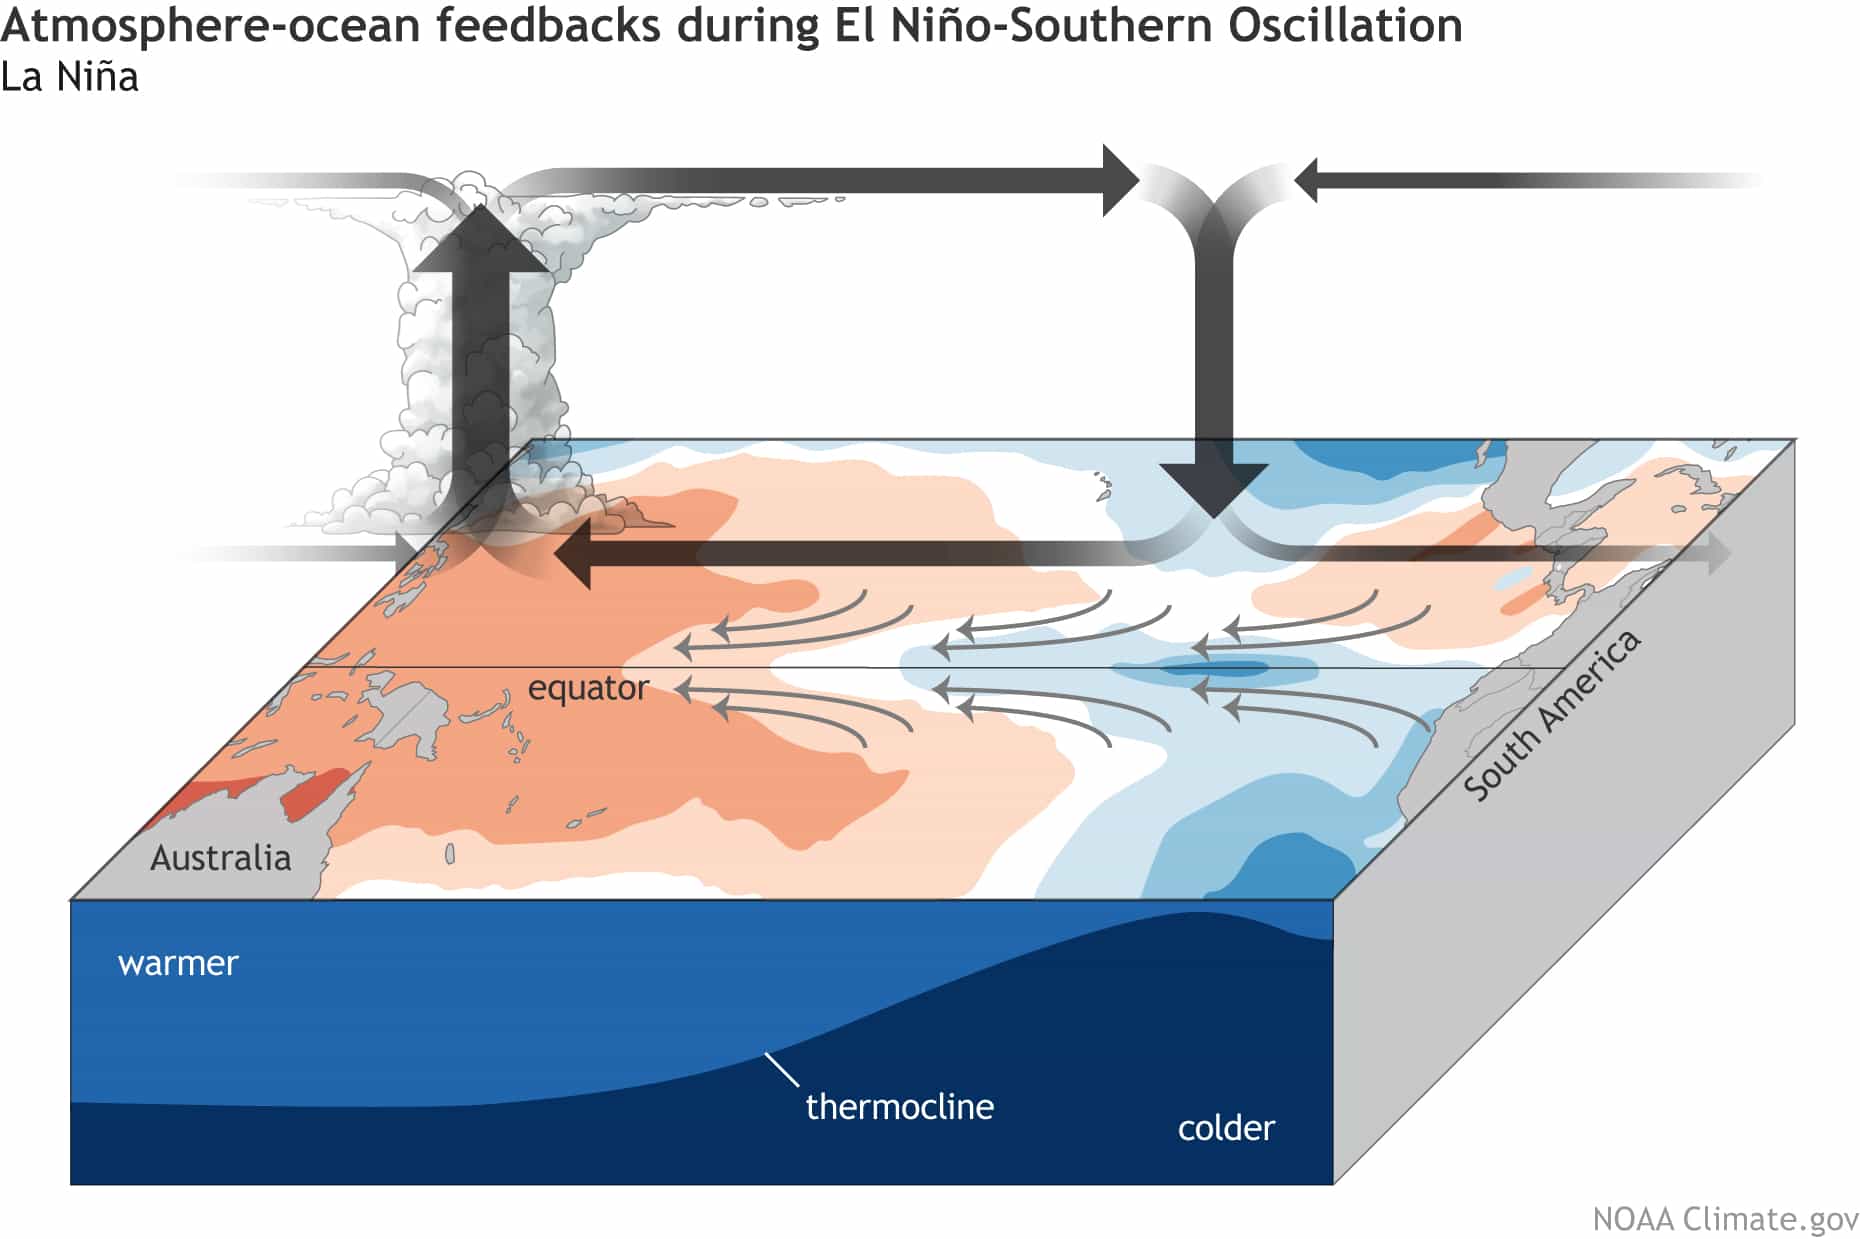
ENSO Blog frequent flyers will know that ENSO is a coupled ocean-atmosphere system. Changes in the tropical Pacific Ocean temperature influence the circulation of the atmosphere (the Walker circulation); those atmospheric changes in turn affect the ocean temperature, and so on. For example, La Niña features cooler-than-average surface water in the central and eastern equatorial Pacific and warmer-than-average surface water in the far western Pacific. This cool-versus-warm pattern leads to less rising air and storms over the central Pacific and more over Indonesia, amping up the normal Walker circulation and driving stronger near-surface winds along the equator—the trade winds. Stronger trade winds further cool the surface and keep even more warm water piled up in the far western Pacific, reinforcing La Niña… you see where I’m going! For more details, visit Michelle’s post on the mechanics of ENSO.
Baby, don’t lose my number
Enough preamble—what’s the Walker circulation doing right now? I thought you’d never ask. It’s really feeling its oats these days, as several different atmospheric measurements tell us.
First, let’s talk Equatorial Southern Oscillation, an index that measures the relative sea level pressure in the far western Pacific vs. that in the eastern Pacific. When the EQSOI is positive, it indicates lower-than-average pressure over the west (more rain and clouds) and higher-than-average pressure over the east (less rain and clouds), i.e., evidence of a stronger Walker circulation. In March, the EQSOI measured 1.4, the 6th strongest since 1950.
As I mentioned above, stronger trade winds are key to the La Niña feedback between the ocean and atmosphere. The trade winds were enhanced through March, and remain stronger than average into mid-April. You want a number, you say? Okay! There’s an index that measures the near-surface winds in the central Pacific region of 5°N–5°S, 175°W–140°W; it was 4.3 meters per second (9.6 miles per hour) faster than average in March. This is the strongest March value on record, but there’s a catch—this record only goes back to 1979.
One more index! The central Pacific was much less cloudy and rainy than average in March. We monitor cloudiness via satellite, by looking at how much radiation is leaving the Earth’s surface and reaching the satellites. Less radiation making it to the satellite means more clouds are blocking the path.
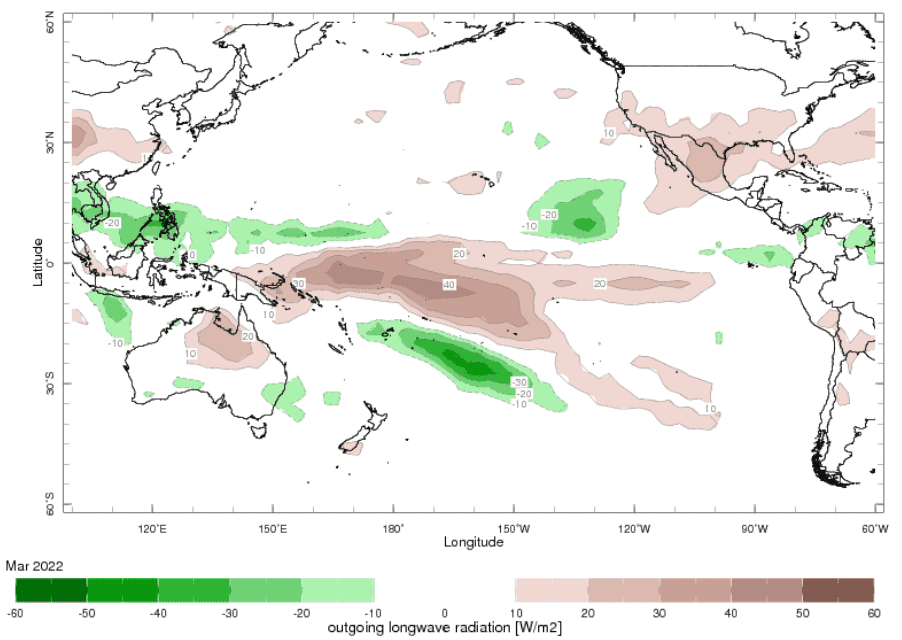
The index that measures outgoing radiation (and therefore cloudiness), the CPOLR, tells us that this March featured the least amount of clouds for any March on record over the central Pacific. We’re number 1! Again, though, like the winds, this record only goes back to 1979, when the satellite measurement era began. So, a grain of salt with your records.
One last measurement today—let’s look under the surface of the tropical Pacific Ocean. The amount of cooler-than-average water under the surface increased in March. This cooler subsurface water provides a supply of cooler water to the surface, contributing to ENSO forecasters’ prediction that La Niña will remain into the summer. Index-wise, last month the water under the surface was the 9th coolest March since 1979.
Add it all up
There are two main information sources for ENSO forecasters: current atmosphere-ocean conditions and computer model predictions. Computer models have a harder time making successful long-range predictions in April, during the spring predictability barrier, although they remain a critical tool. Current model predictions are mostly split between staying in La Niña or transitioning to neutral in summer. Looking out to next fall, the North American Multi-Model Ensemble is leaning toward La Niña conditions.
There is a lot of uncertainty in the current forecast, which is reflected in the probabilities. The odds for La Niña to remain through the next few months are fairly confident, bolstered by the cooler subsurface water and the current strong Walker circulation. The chance of a third-year La Niña has a slight edge for the fall, over the chance of neutral conditions. El Niño is unlikely—less than 10% chance. None of the models are predicting El Niño for the fall, and none of those March atmospheric conditions I described earlier have been followed by El Niño later in the year. It’s not impossible—nature is full of surprises—but very unlikely.
La Niña influences the hurricane season (more storms in the Atlantic, fewer in the eastern Pacific), has links to springtime tornado activity (complicated links!), and can increase the chance of drought in some regions. Given all these important relationships, we will closely watch the forecast and look forward to starting to emerge from the spring predictability barrier in the months ahead.
This post first appeared on the climate.gov ENSO blog and was written by Emily Becker.