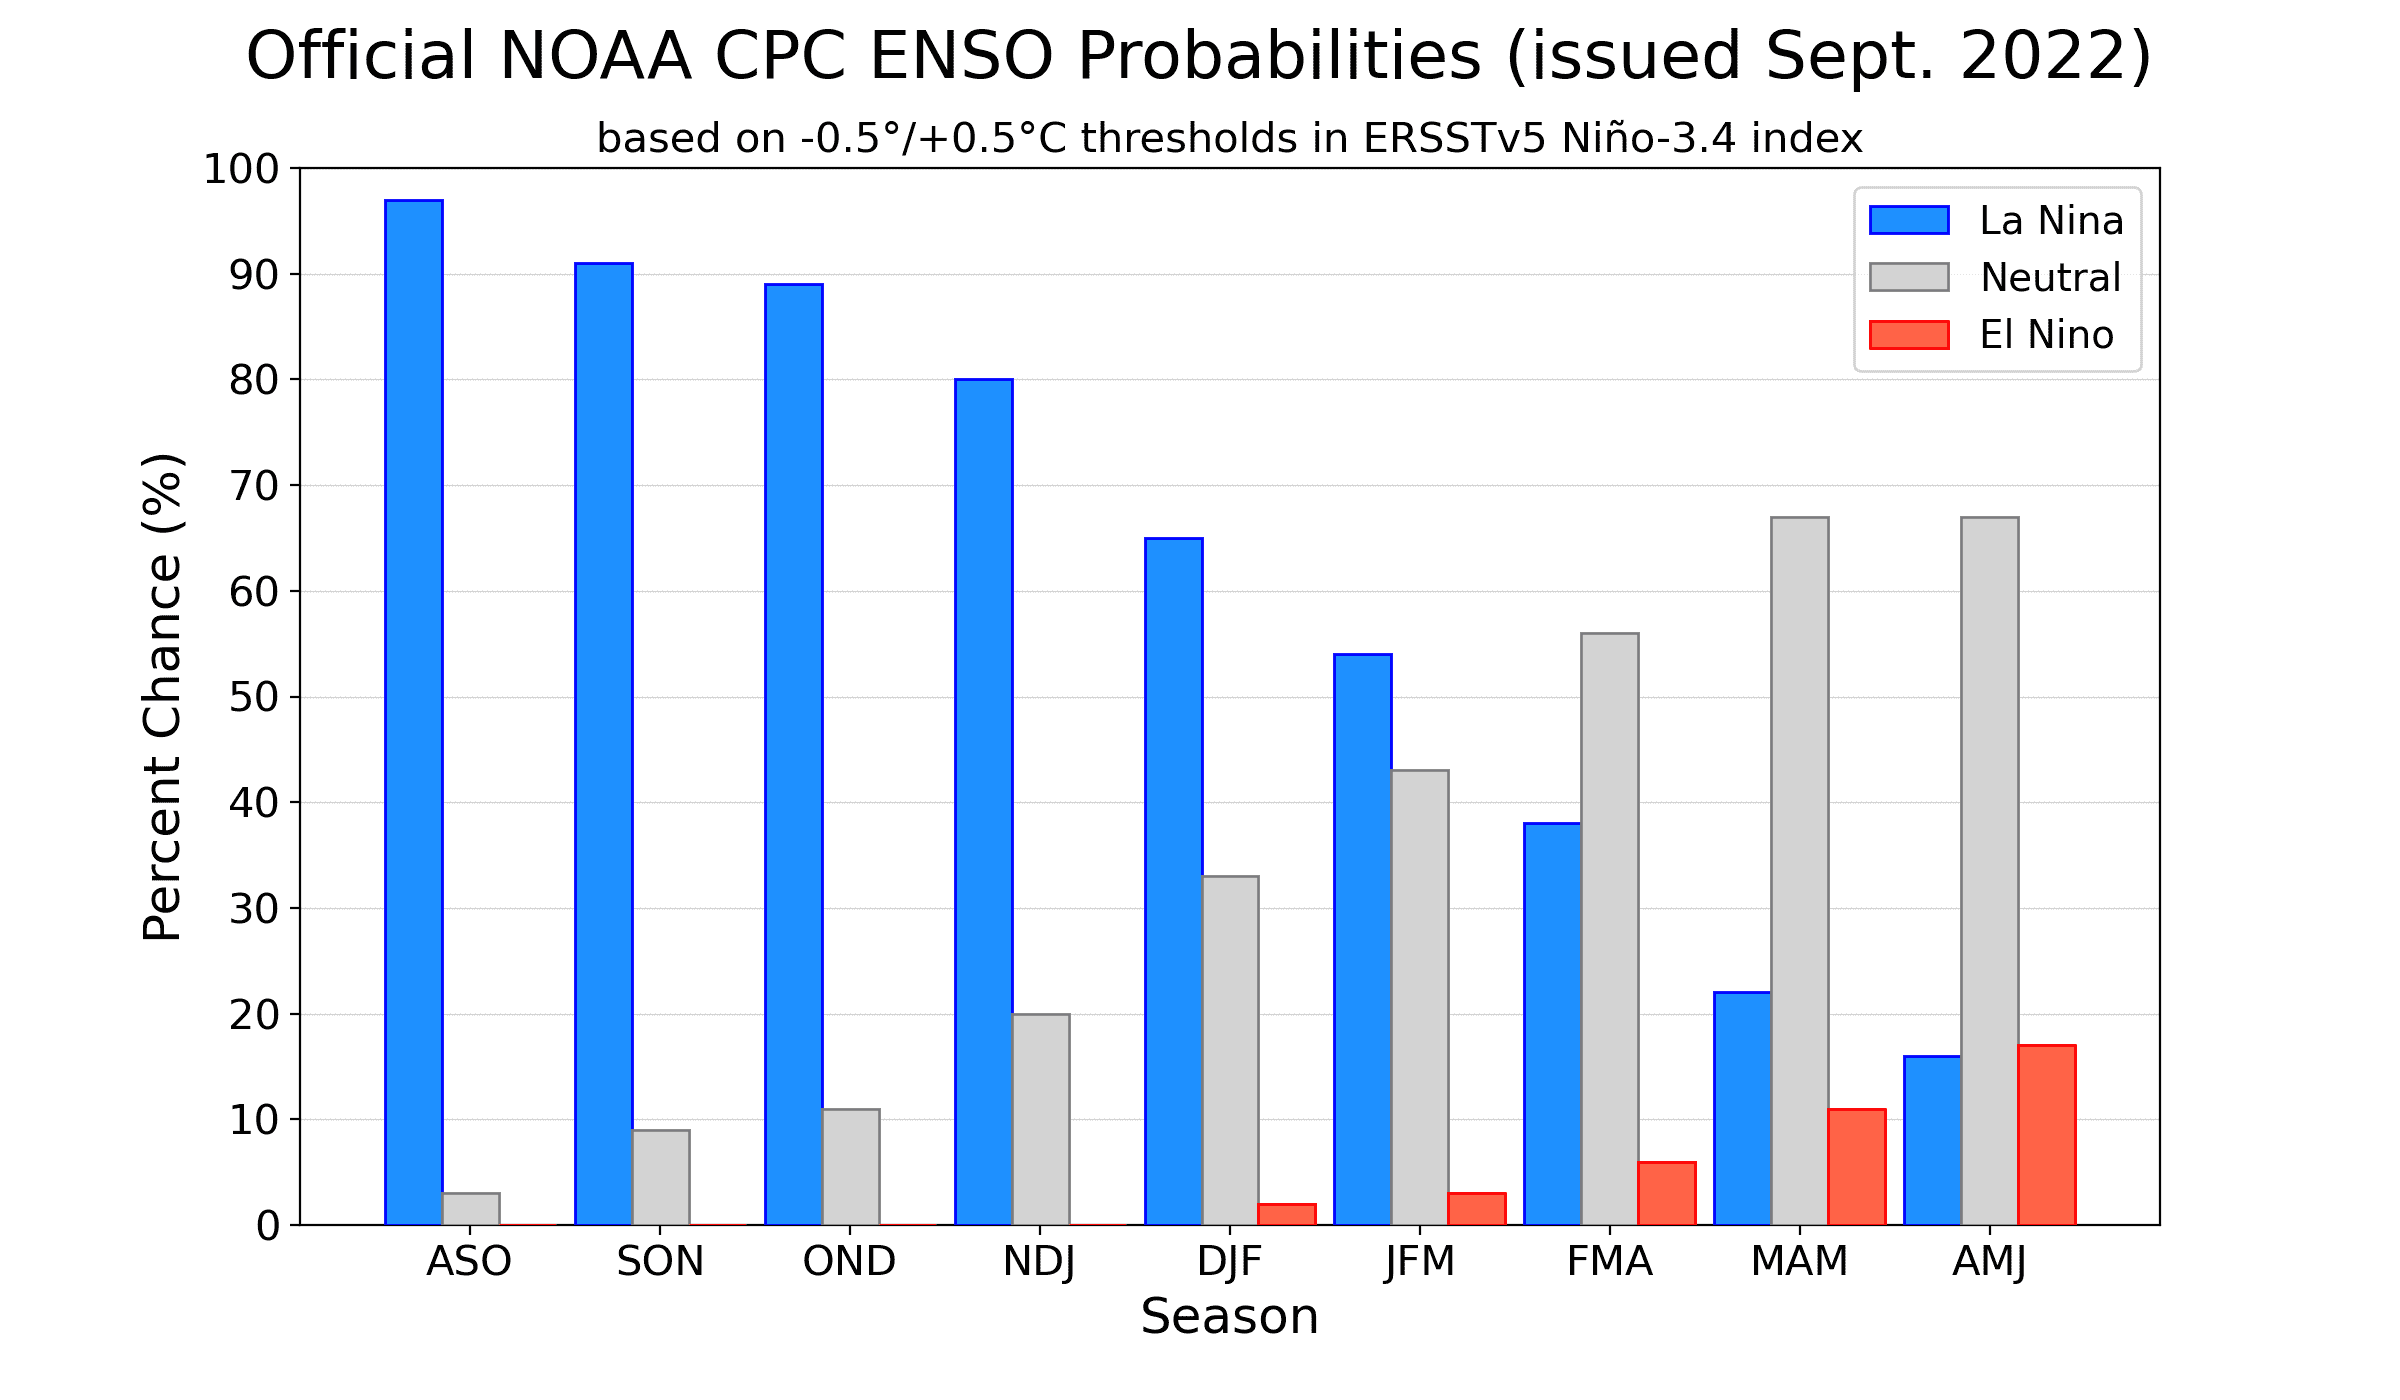
Ocean and atmospheric conditions tell us that La Niña—the cool phase of the El Niño-Southern Oscillation (ENSO) climate pattern—currently reigns in the tropical Pacific. It’s looking very likely that the long-predicted third consecutive La Niña winter will happen, with a 91% chance of La Niña through September–November and an 80% chance through the early winter (November–January).
91%! That’s very high. Why so confident?
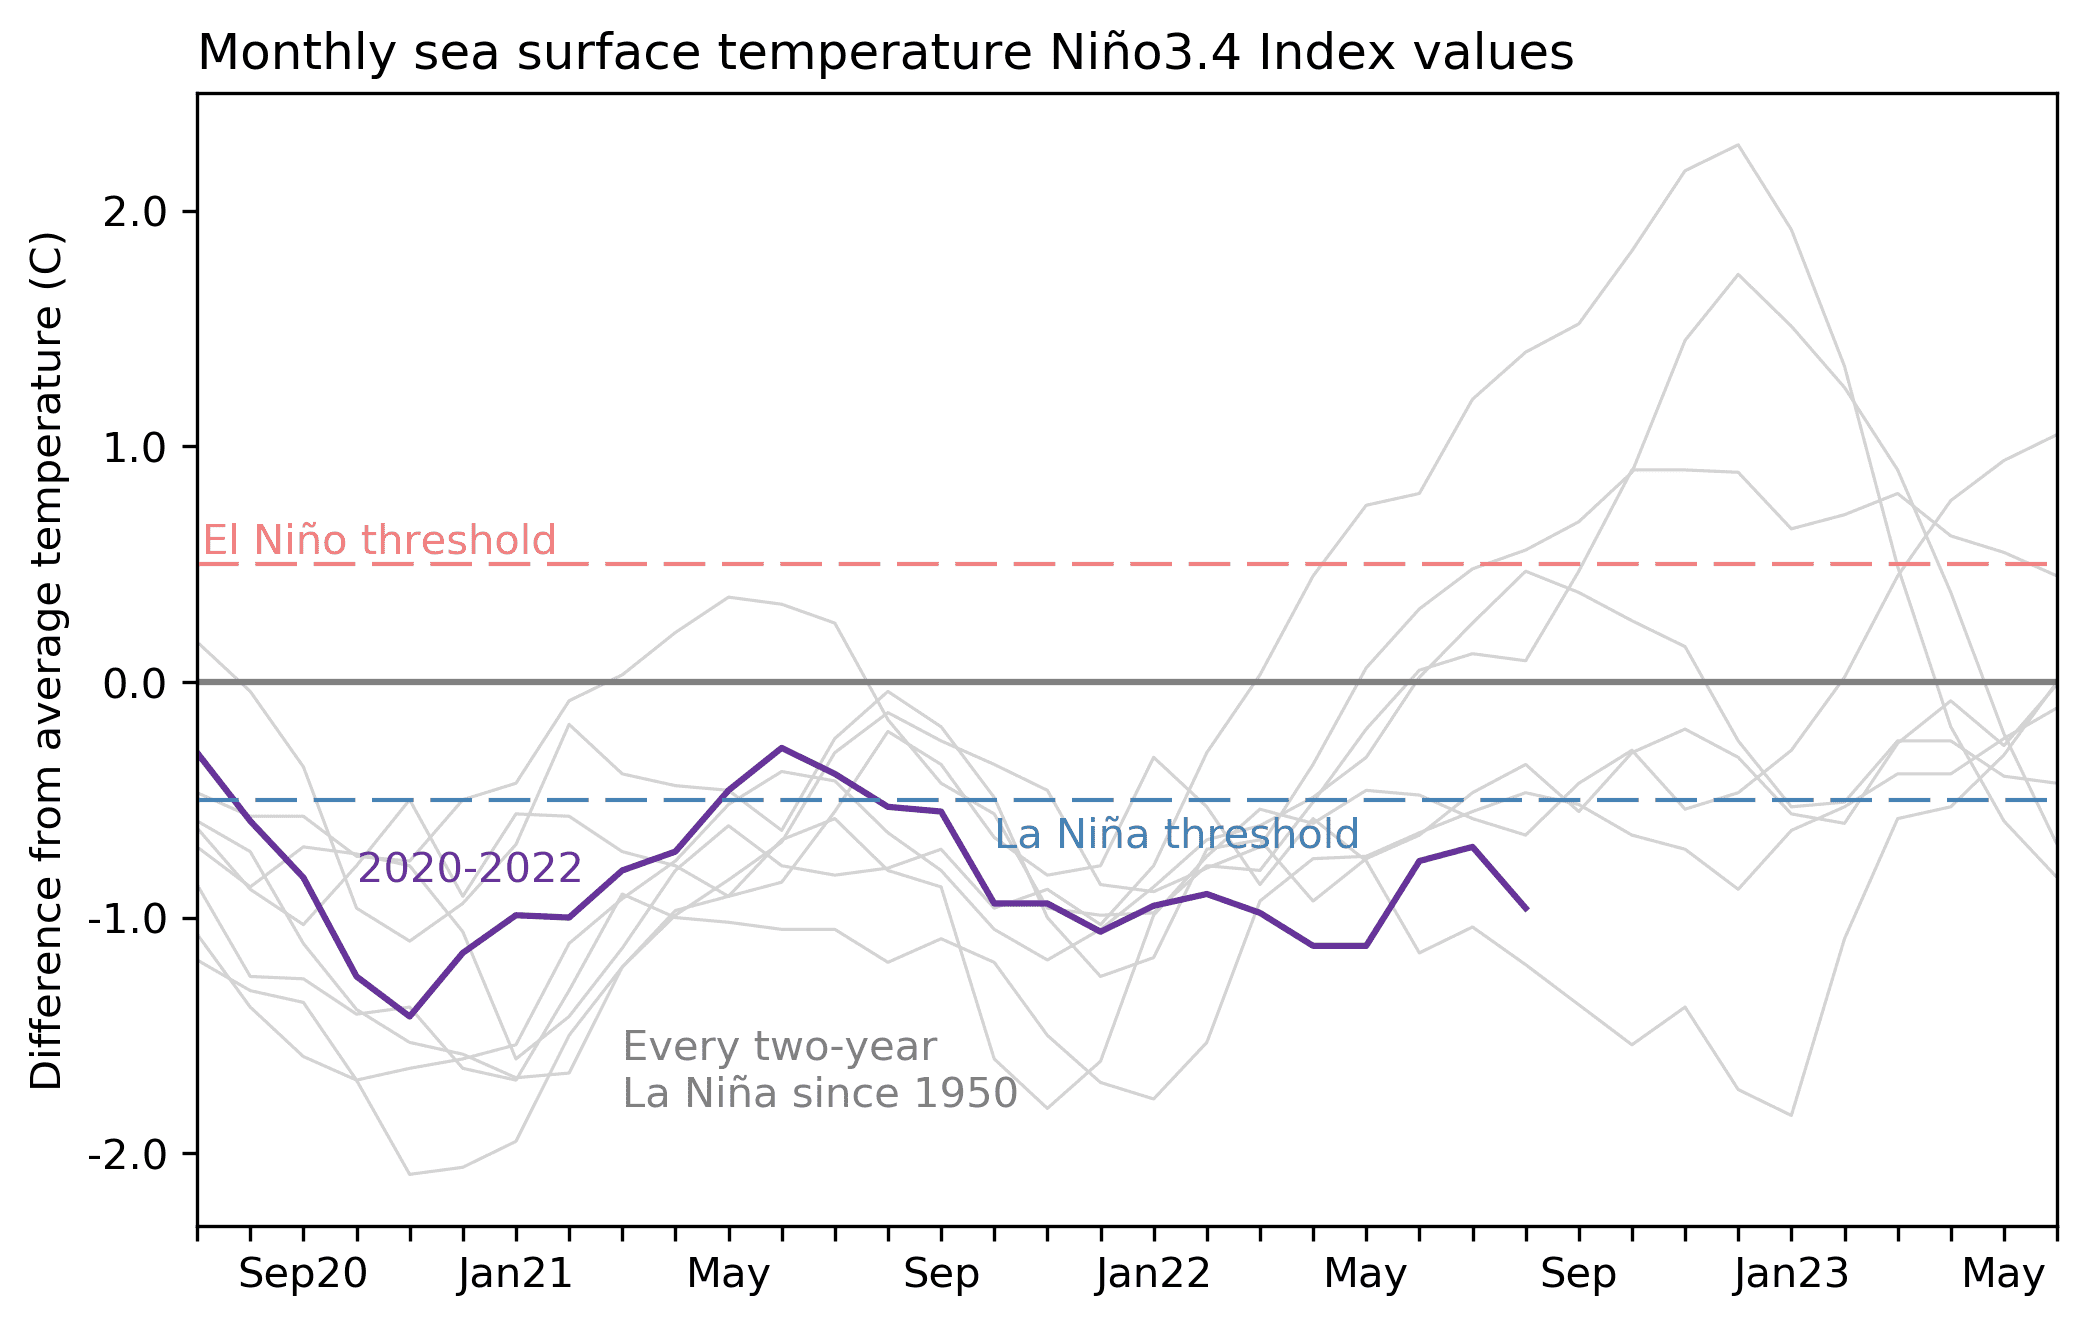
The first reason is that La Niña is already clearly in force in the tropical Pacific. The August sea surface temperature in the Niño-3.4 region, our primary location for ENSO monitoring, was about 1.0 °C (1.8 °F) cooler than the long-term average, according to ERSSTv5, our favorite dataset for sea surface temperature. (“Long-term” is currently 1991–2020.) This is substantially cooler than the La Niña threshold of 0.5 °C (0.9 °F) below average.
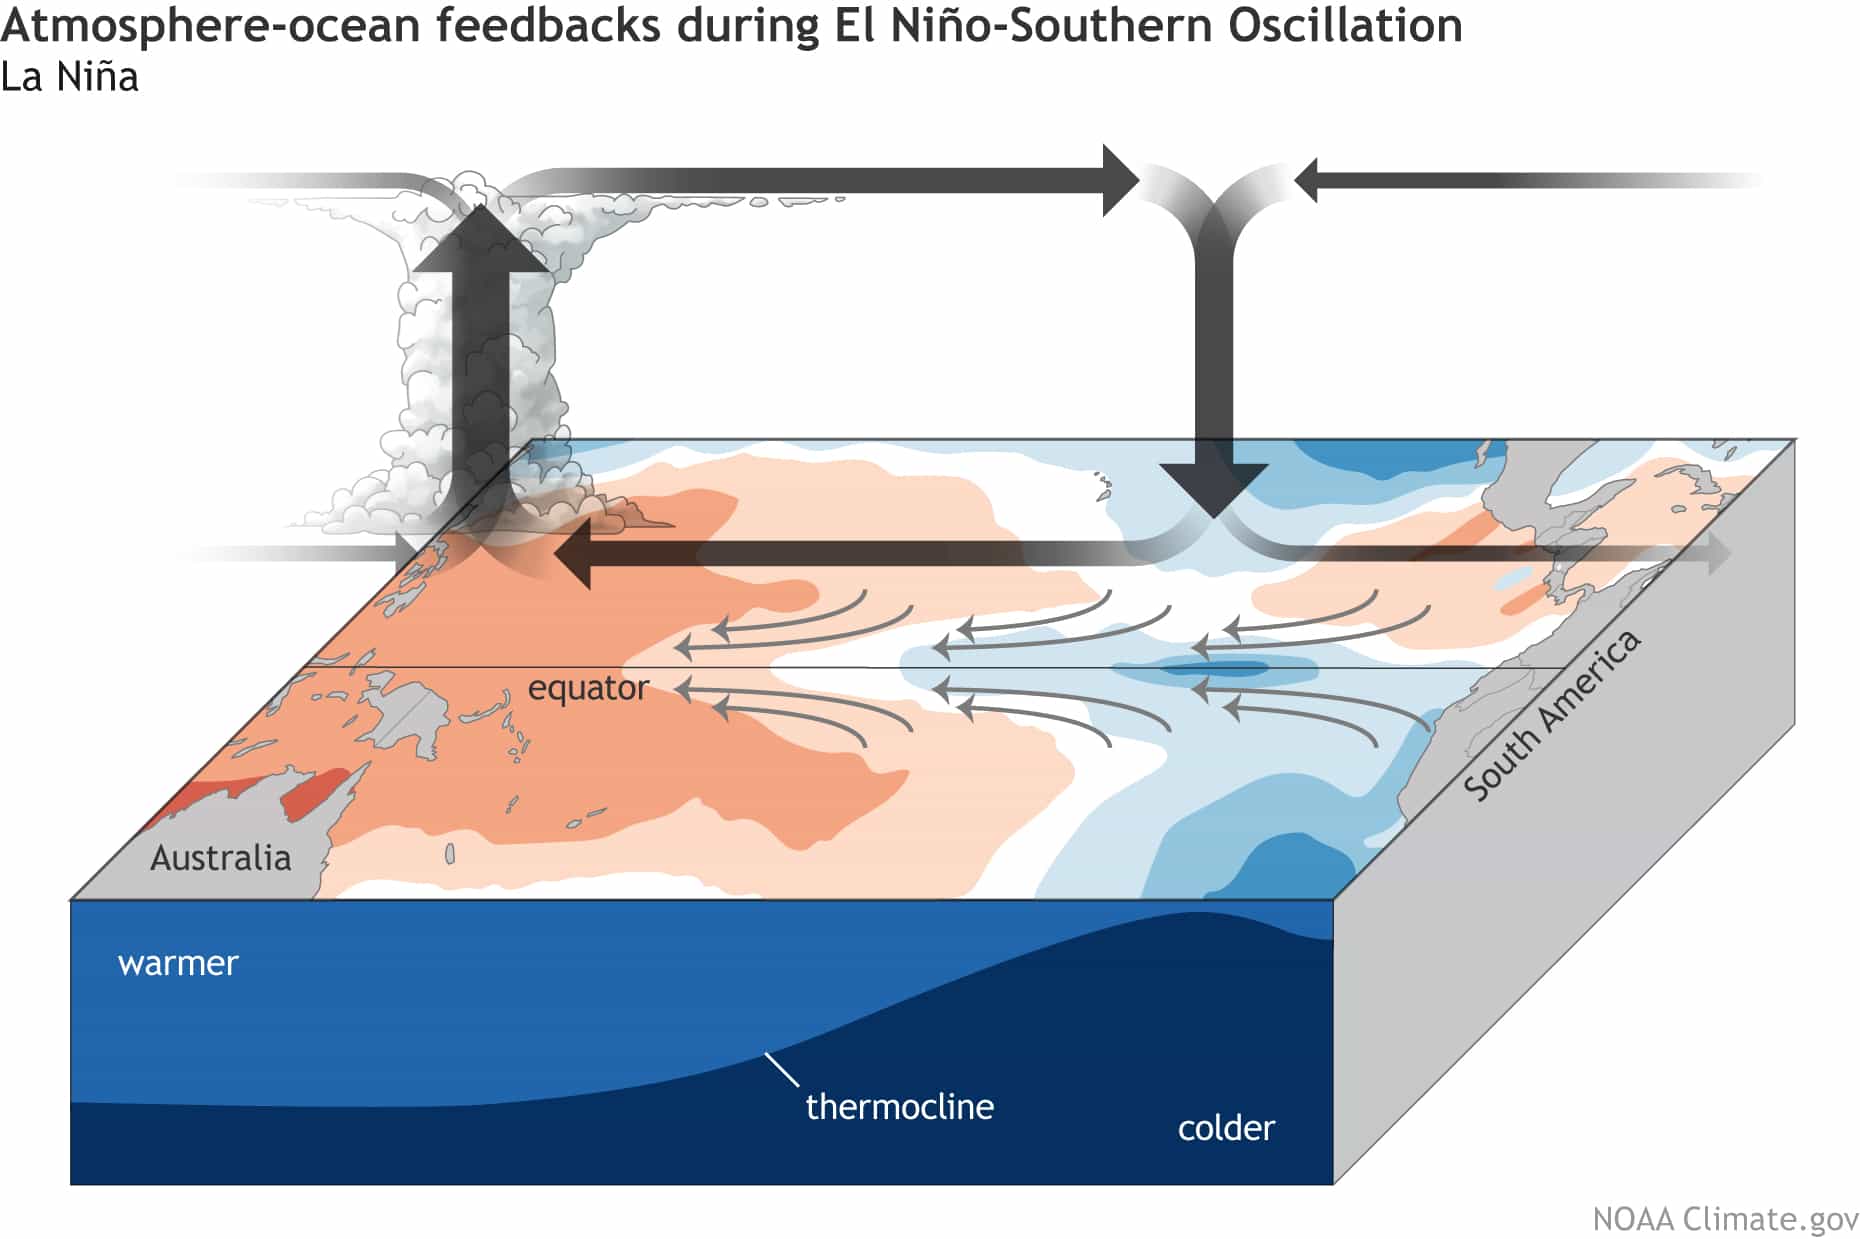
La Niña’s characteristic tropical atmospheric response—more rain and clouds over Indonesia, less over the central Pacific, and stronger-than-average winds both aloft and near the surface—was also clearly active in August. Taken together, the oceanic and atmospheric conditions tell us that La Niña is solidly in place. Once active, La Niña conditions are reinforced by feedback processes between the ocean and atmosphere. Read more about those feedbacks here.
What else is providing confidence in the forecast?
There is a substantial amount of cooler-than-average water under the surface of the eastern-central tropical Pacific. This subsurface water will provide a source of cooler water to the surface over the next couple of months. Also, the computer climate model consensus predicts that La Niña will continue into the winter.
How long will La Niña last?
While there’s high agreement through the winter, there is a lot of uncertainty about how long this La Niña will last and when we will see a transition to neutral conditions. Current forecaster consensus gives La Niña the edge through January–March (54%), with a 56% chance of neutral for the February–April period.
When have previous La Niñas transitioned to neutral?
There are 24 La Niña winters in our historical record, which dates back to 1950. Of those, only one (2016–17) changed to neutral in December–February. Four transitioned to neutral in January–March, one (2000–01) by February–April, two by March–May, and 16 in April–June or later. Especially when you’re slicing and dicing a relatively short record, it’s tough to find truly analogous events. For example, this will be only the third La Niña three-peat on record, and the first not to follow a strong El Niño event.
All this is to say that past La Niñas aren’t providing much guidance on how long we can expect this event to last. The current forecaster estimate, which favors an earlier than typical transition to neutral, is based on computer model guidance.
Remind me why I should care about La Niña…?
I admit, as scientists, we sometimes get wrapped up in how interesting the inner workings of El Niño and La Niña are! But ENSO has some serious practical applications. In a nutshell, La Niña and El Niño affect global atmospheric circulation patterns in (somewhat) predictable patterns, altering jet streams and storm tracks around the world and influencing temperature, rain/snow, and tropical cyclone seasons. Since we can predict ENSO months in advance, we can get an early picture of potential upcoming climate patterns. Of course, nothing is guaranteed with weather and climate—ENSO merely “tilts the odds” toward certain patterns. For more on how ENSO affects climate patterns, as well as why it’s so difficult to make specific predictions, check out Michelle’s post here.
Can I have some examples of how La Niña can affect North American weather?
Yes! Here’s a map, followed by a list of some specifics.
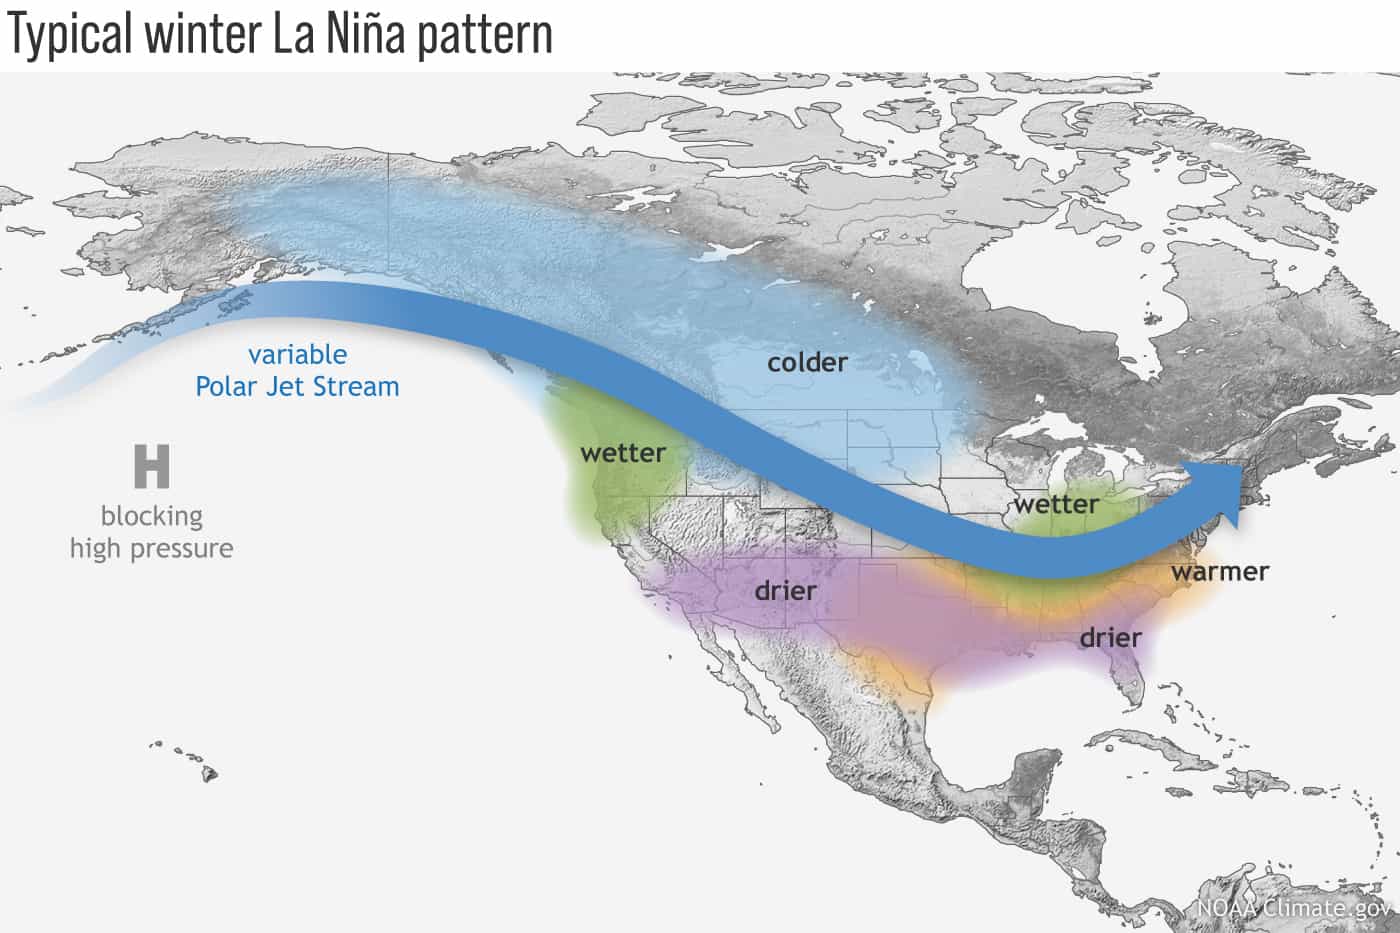
- La Niña tends to increase Atlantic hurricane season activity.
- La Niña winters tend to be drier through the southern tier of the US. This can lead to or exacerbate drought.
- La Niña can also result in wetter (and snowier) conditions for parts of the northern tier of the US.
- Nat recently looked into the potential for hotter, drier summers in Texas following La Niña winters.
- La Niña is linked to more frequent spring hailstorms and tornadoes in the south-central US.
- La Niña winters in Alaska tend to be cooler and wetter, and La Niña winters in Hawaiitend to be rainier.
- La Niña can reduce the number of atmospheric rivers impacting the West Coast.
What about global impacts?
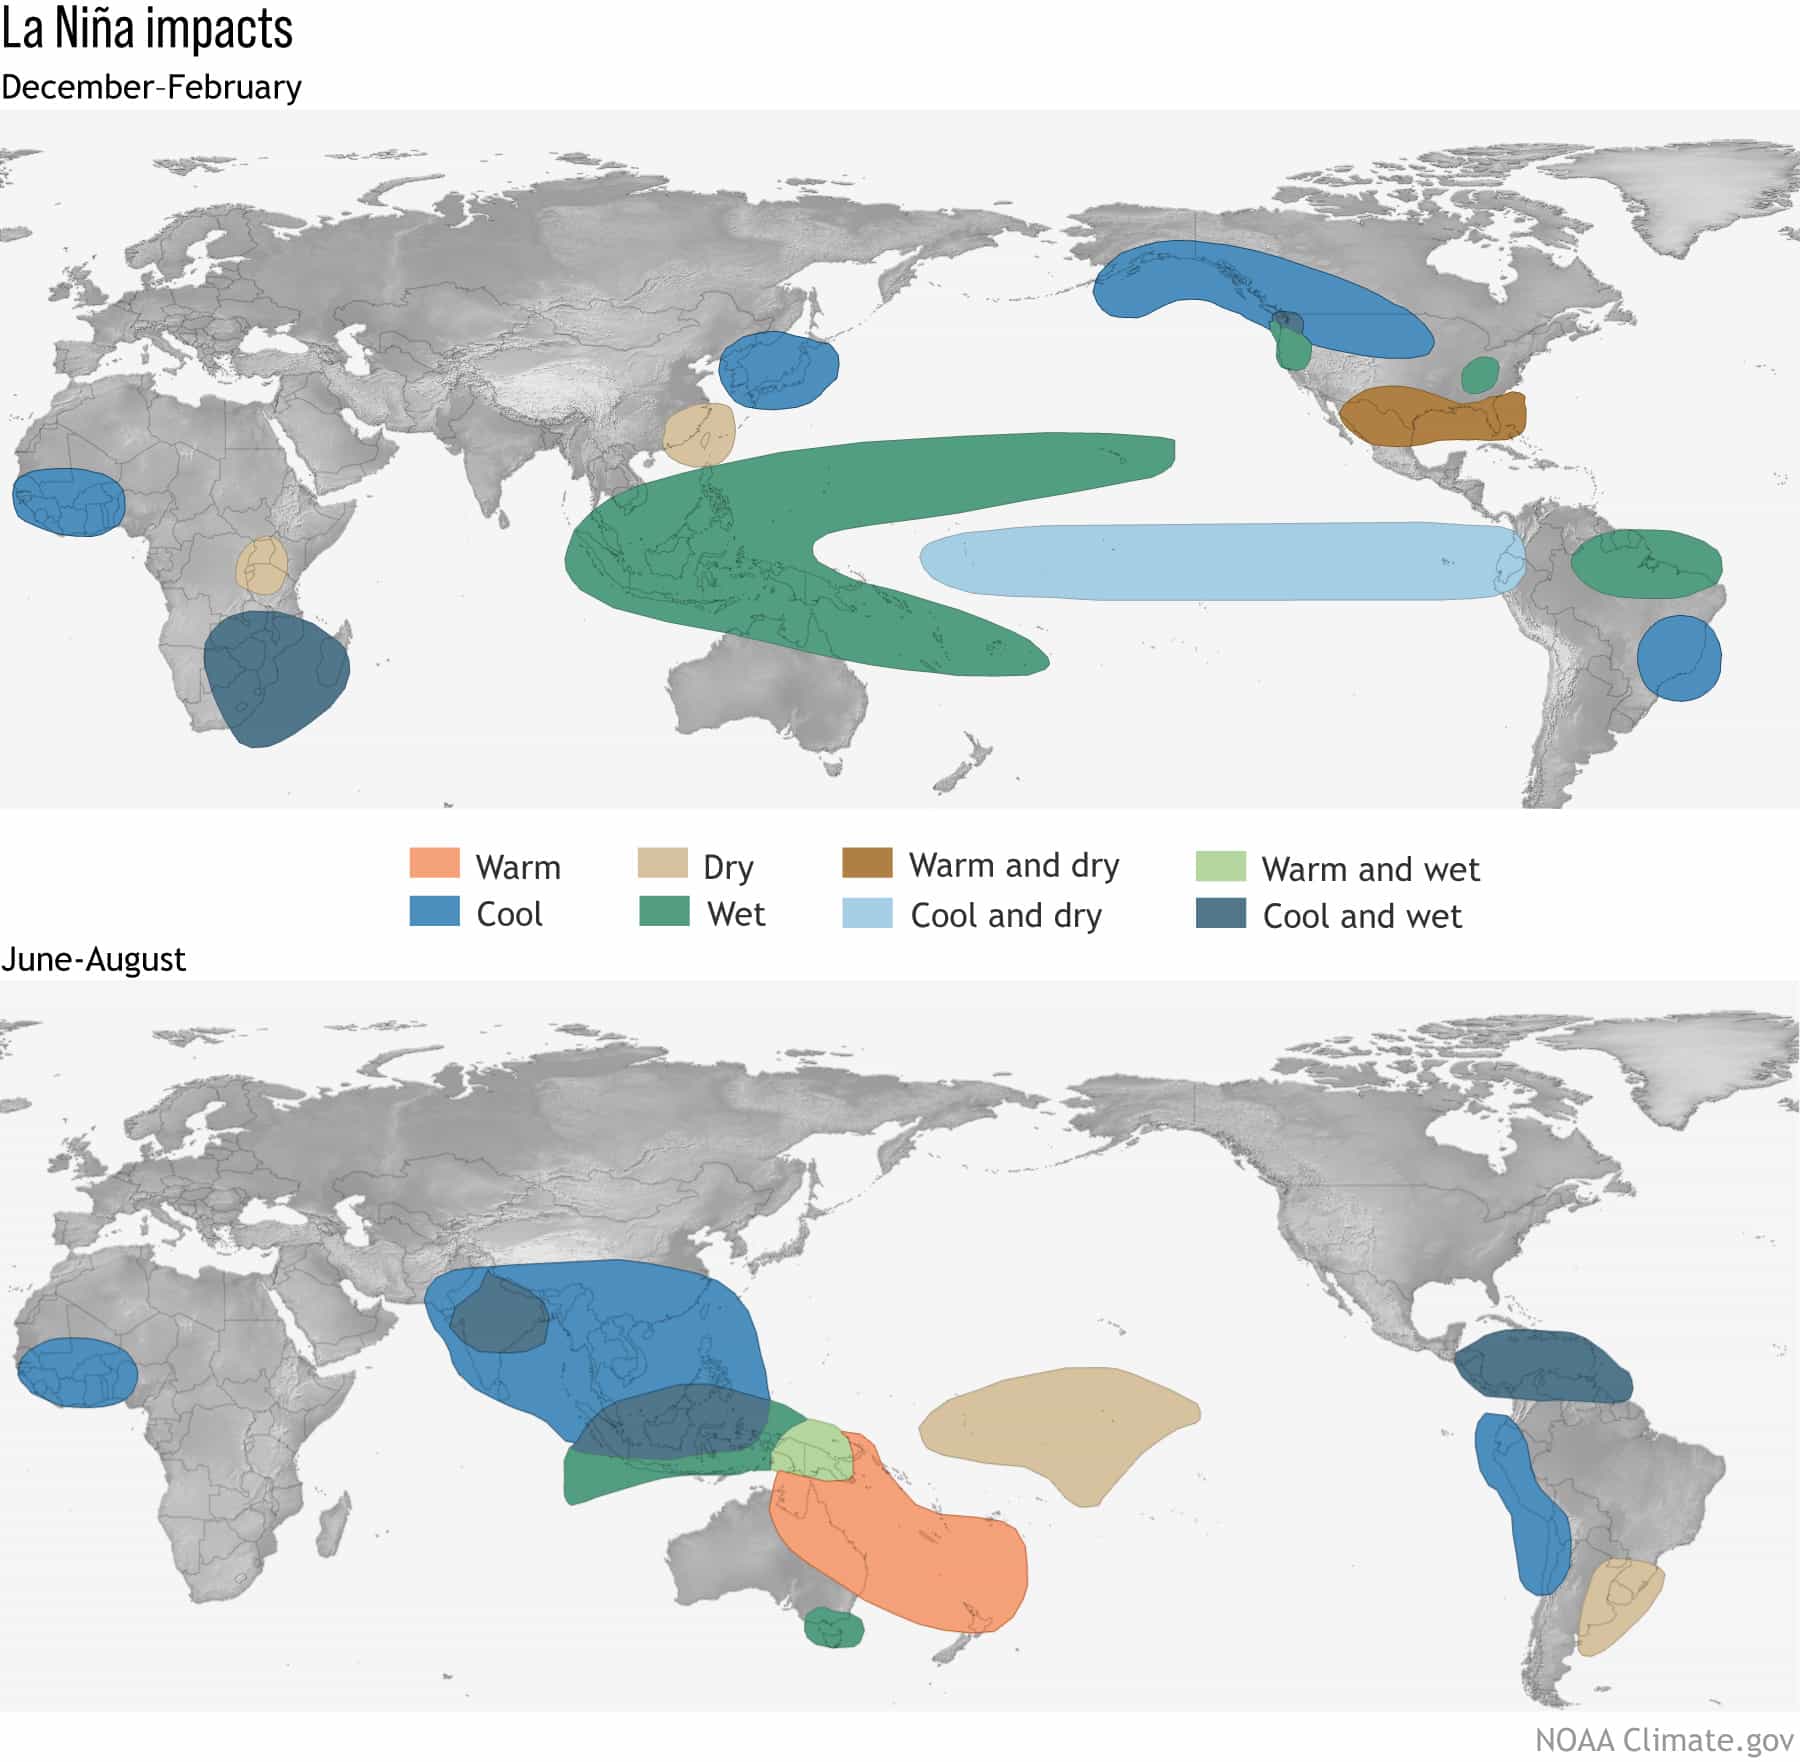
- La Niña can reduce crop yields in several regions around the world.
- La Niña tends to produce colder, drier conditions in west Antarctica.
- La Niña’s effect on South American climate is complex!
That’s enough for now! Thanks!
Anytime! See you next month.
This post first appeared on the climate.gov ENSO Blog and was written by Emily Becker.