
NOAA had been calling for La Nina this Fall/Winter for North America since last spring. They issued a La Nina Watch, said La Nina had a 75% chance of happening, then they canceled the La Nina Watch on September 8th, 2016 and said that La Nina wasn’t favored to happen.
Today, NOAA has issued a new La Nina Watch giving La Nina a 70% chance of happening again…
Weird!
“Synopsis: La Niña is favored to develop (~70% chance) during the Northern Hemisphere fall 2016 and slightly favored to persist (~55% chance) during winter 2016-17.” – NOAA, today
Tons of NOAA information about the La Nina Watch issued today below:

Antici…pation: October 2016 ENSO forecast
What a difference a month can make! Since my last post, the tropical Pacific has changed gears, and now forecasters think there’s a 70% chance that La Niña conditions will develop this fall. However, any La Niña that develops is likely to be weak, and forecasters aren’t quite as confident that La Niña conditions will persist long enough to be considered a full-blown episode, giving it a 55% chance through the winter.
Ch-ch-ch-changes
When I wrote last month, the tropical Pacific wasn’t giving us much evidence that the atmosphere was responding to the slightly cooler-than-average ocean surface, and most of the computer models were predicting that sea surface temperatures would head back toward average.
Remember, La Niña (just like El Niño) requires action in both the ocean and the atmosphere. During La Niña, the ocean surface in the central and eastern tropical Pacific gets cooler than normal, leading to sinking air and less rain above that region, just as the waters near Indonesia get warmer and cause more rising air and rain. This stronger Walker Circulation is completed by stronger east-to-west surface winds and west-to-east upper level winds.

Generalized Walker Circulation (December-February) anomaly during La Niña events, overlaid on map of average sea surface temperature anomalies. Anomalous ocean cooling (blue-green) in the central and eastern Pacific Ocean and warming over the western Pacific Ocean enhance the rising branch of the Walker circulation over the Maritime Continent and the sinking branch over the eastern Pacific Ocean. Enhanced rising motion is also observed over northern South America, while anomalous sinking motion is found over eastern Africa. NOAA Climate.gov drawing by Fiona Martin.
This atmospheric circulation works to enhance the cooler ocean surface, both by blowing across the surface just like you’d cool the surface of your coffee, and also by causing cold water from the deep ocean to rise up. Have you ever blown on the surface of a cup of coffee that has cream in it, but hasn’t been stirred up? You’ll see the cream rise up to the surface, brought there by the circulation you’ve created.
Enough with the coffee! Get back to La Niña!
Right, sorry. Anyway, we really didn’t see much of this cycle happening during the summer. Some weak indications were there, but nothing really locked in, and nothing was giving forecasters much confidence that La Niña was still developing. Also, the greater cooling in the tropical Pacific Ocean that had been forecast by earlier computer model predictions from the spring and summer didn’t happen.
Then, starting around mid-September and continuing through the beginning of October, the trade winds in the central tropical Pacific area picked up.

Average near-surface winds during September 10—October 1, 2016, compared to the 1982-2010 average. Negative numbers indicate that the wind is more easterly: the east-to-west wind is stronger than average. The winds along the equator usually blow east-to-west (the trade winds); the pink area shows the enhanced trades. Climate.gov figure from CPC data.
Short-term fluctuations in the wind like this can be difficult to predict more than a week ahead of time. This burst was associated with subseasonal variability—changes that happen over a few days or a couple of weeks.
Several other indicators also started to look more La Niña-like during September, including more clouds and rain over Indonesia and less in the central Pacific. The two measurements we use to follow the relationship between the conditions in the east/central Pacific and Indonesia, theSouthern Oscillation Index and the Equatorial Southern Oscillation Index, are both positive. This means lower-than-average air pressure over Indonesia and higher-than-average in the east/central Pacific—a more-active Walker Circulation. (Check out Tony’s post about the many ways we measure ENSO.)
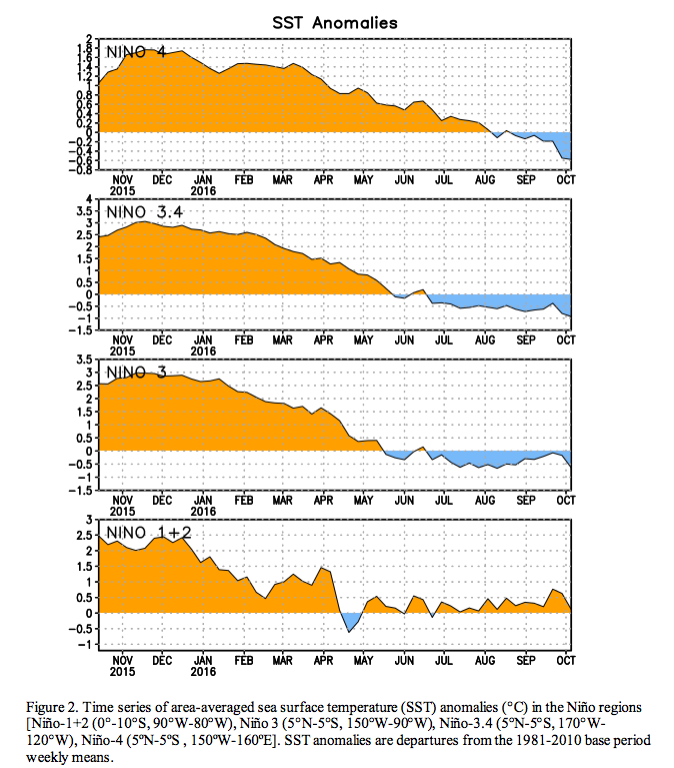
And then, of course, there’s the sea surface temperature in the Niño3.4 region, which dropped slightly during September, averaging around 0.6 degrees C below average, and became even cooler toward the end of the month.

Monthly sea surface temperature in the Niño 3.4 region of the tropical Pacific compared to the long-term average for all moderate-to-strong El Niño years and the following year since 1950, showing how 2015/16 (black line) compares to other events. Climate.gov graph based on ERSSTv4 temperature data.
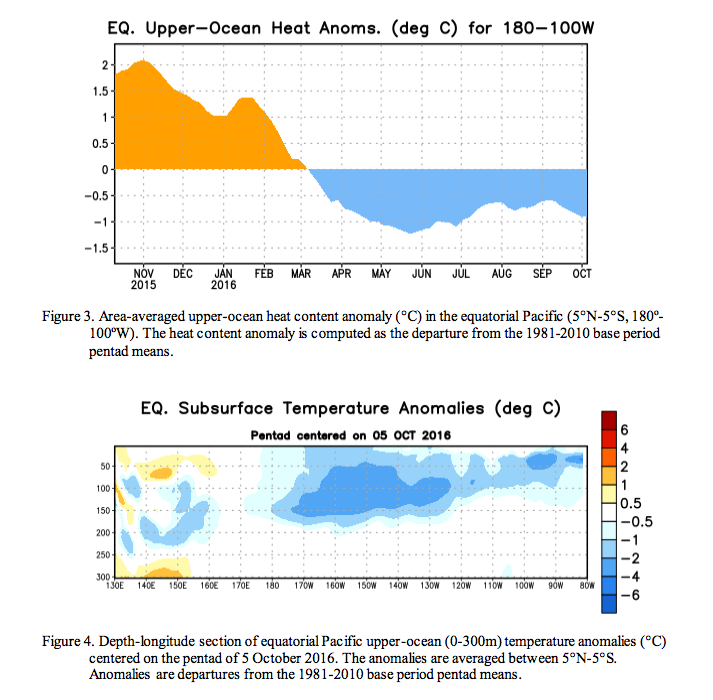
The amount of cool water below the surface increased a bit during September, too, after a few months of gradual reduction from the large amount that was present in the spring. This cooler water provides a source for future surface cooling.
All this adds up to a renewed La Niña Watch, as it looks like conditions are favorable for La Niña to develop.
However…
El Niño and La Niña are seasonal phenomena, meaning that these specific conditions have to be present for several months in a row. There can be short-term fluctuations in the winds, pressure, and so on, but the average over the several months must be consistent. This is why ENSO is considered a seasonal climate, not weather, phenomenon.
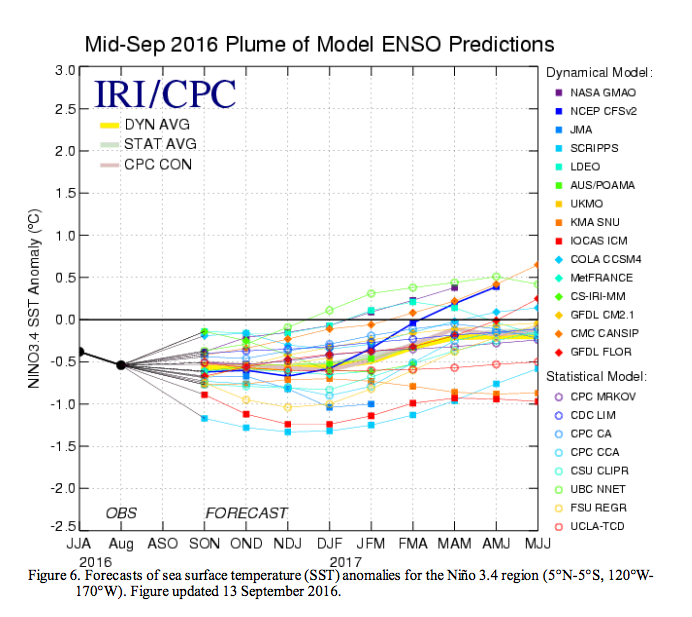
So we’ll watch the tropical Pacific closely over the next month, to see if the suggestions of La Niña that showed up in the second half of September are here to stay. The current computer model forecasts {{check link}} are predicting a few more three-month-average periods of around half a degree (C) below average in the Niño3.4 region—right at the La Niña threshold.
A weak La Niña likely means lower confidence impacts on U.S. weather and climate during the winter compared to a stronger event. Stay tuned for an upcoming post about the Climate Prediction Center’s winter outlook.

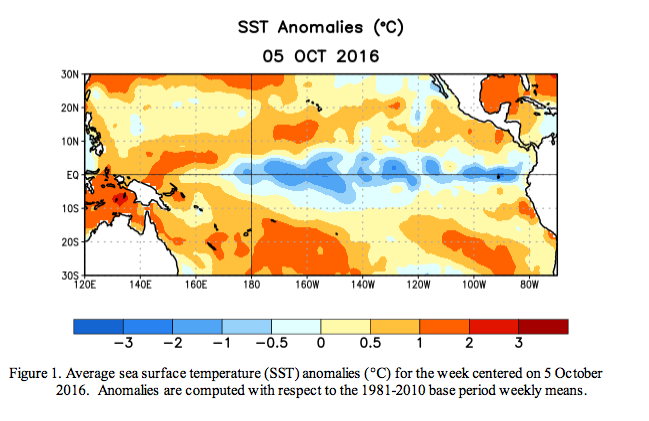
Average sea surface temperature during September, 2016, compared to the 1981-2010 average. Climate.gov figure, from CPC data. All resemblance to a lava lamp is accidental.
***
| EL NIÑO/SOUTHERN OSCILLATION (ENSO) |
| DIAGNOSTIC DISCUSSION |
| issued by CLIMATE PREDICTION CENTER/NCEP/NWS and the International Research Institute for Climate and Society |
| 13 October 2016 |
|
ENSO Alert System Status: La Niña Watch |
|
Synopsis: La Niña is favored to develop (~70% chance) during the Northern Hemisphere fall 2016 and slightly favored to persist (~55% chance) during winter 2016-17. ENSO-Neutral conditions were observed during September, with negative sea surface temperatures (SSTs) anomalies expanding across the eastern equatorial Pacific Ocean by early October (Fig. 1). All of the Niño regions cooled considerably during late September and early October, with the latest weekly value of Niño-3.4 index at -0.9°C (Fig. 2). Subsurface temperature anomalies also decreased toward the end of the month (Fig. 3), reflecting the strengthening of below-average temperatures at depth in the east-central equatorial Pacific (Fig. 4). Atmospheric anomalies across the equatorial Pacific edged toward La Niña during September, with a stronger tendency toward La Niña late in the month. The traditional Southern Oscillation index and the equatorial Southern Oscillation index were positive. The lower-level winds were near average across most of the basin during the month, but enhanced easterlies were becoming more persistent west of the International Date Line. Upper-level winds were anomalously westerly near and just east of the International Date Line. Convection was weakly suppressed over the central tropical Pacific and was more enhanced over Indonesia compared to last month(Fig. 5). Overall, the combined ocean and atmosphere system reflects ENSO-Neutral during September, but are more clearly trending toward La Niña conditions. The multi-model averages favor borderline Neutral-La Niña conditions (3-month average Niño-3.4 index less than or equal to -0.5°C) persisting during the Northern Hemisphere fall and continuing into the winter (Figs. 6 and 7). Because of the recent cooling in the Niño-3.4 region and signs of renewed atmospheric coupling, the forecaster consensus now favors the formation of a weak La Niña in the near term, becoming less confident that La Niña will persist through the winter. In summary, La Niña is favored to develop (~70% chance) during the Northern Hemisphere fall 2016 and slightly favored to persist (~55%% chance) during winter 2016-17 (click CPC/IRI consensus forecast for the chance of each outcome for each 3-month period).period). This discussion is a consolidated effort of the National Oceanic and Atmospheric Administration (NOAA), NOAA’s National Weather Service, and their funded institutions. Oceanic and atmospheric conditions are updated weekly on the Climate Prediction Center web site (El Niño/La Niña Current Conditions and Expert Discussions). Forecasts are also updated monthly in the Forecast Forumof CPC’s Climate Diagnostics Bulletin. Additional perspectives and analysis are also available in an ENSO blog. The next ENSO Diagnostics Discussion is scheduled for 10 November 2016 . To receive an e-mail notification when the monthly ENSO Diagnostic Discussions are released, please send an e-mail message to: ncep.list.enso-update@noaa.gov. |
NOAA is a corrupt government organization that doesn’t know their head from their ass. Vegas would do a better job of predicting the weather than these clowns who are consistently wrong year after year. They manipulate data to show no existent warming trends to “prove” the “global warming,” aka “climate change,” scam is “real.” They are frauds. This is not conspiracy theory. Look at the raw data, unadjusted, in homogenized data and see for yourself. You will be shocked. People who believe the crap are either:
A. Part of the scam (fed gov)
B. Grift off the scam (e.g. University researches who get grants to go on exotic annual vacations to “prove” climate change)
C. Useful idiots (eg people who are to lazy or stupid to research the issue and come to their own justified opinion and instead just parrot the party line)
The alarm clock has been ringing for years. It’s time to wake up.
GTFO with that noise. Nobody’s buying it. The ship has sailed. The train has left the station. You and your ilk lost your argument with science a long time ago.