The NOAA, through a recent post on their ENSO (El Niño/La Niña monitoring) blog, has provided us with a March 2018 update and insight into current and future conditions.
Tl;dr: Last year’s strong La Niña is fading, with a likelihood that neutral conditions will return between Mar-May and continue through the summer. The below surface sea temperatures of the Pacific, which have been colder than average since last August, have been rising and exceeded normal temperatures in February. These warmer temperatures, contrasted with cooler than average below surface temperatures south of the equator, can influence the wind patterns along the equator, thereby also influencing future El Niño/La Niña conditions. Watch this space!
NOAA reports that the great La Niña of 2017–18 is waning, and forecasters expect with 55% likelihood the return of neutral conditions by the March-May season, which is expected to continue through the summer. It’s too early to get a picture of next fall and winter, due to the spring predictability barrier and the absence of strong signs one way or the other. There are a few interesting features we’ll watch closely over the next few months… but first, this update on current conditions!
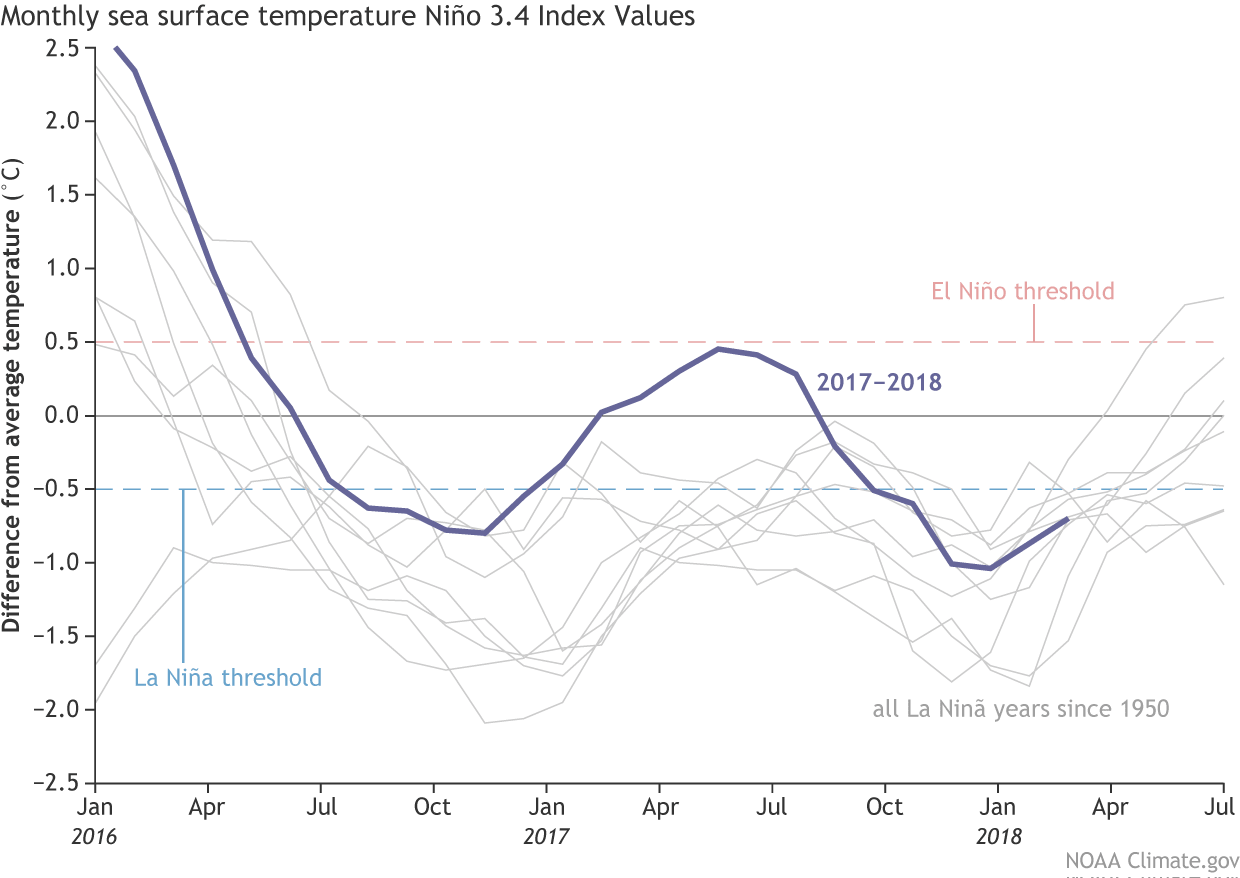
La Niña may be weakening, but she’s still making an impression on the average sea surface temperature in the equatorial Pacific, diminishing some -0.7°C during February, with the amount of rain and clouds the central Pacific returning to near-normal, and Indonesia actually somewhat drier than average.
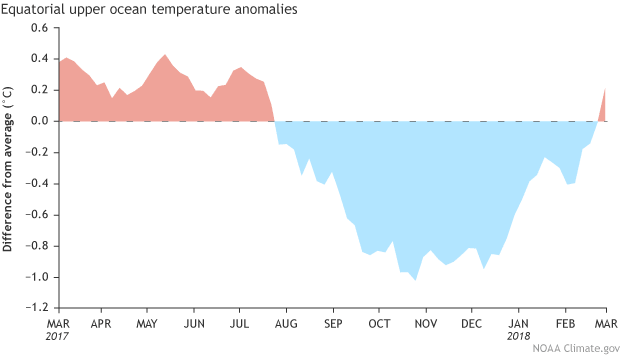
One of the many elements of the Pacific ocean-atmosphere system that ENSO forecasters monitor pretty closely is the temperature of the water below the surface. Colder than the long-term average since August 2017, these waters crept to above normal temperatures in February.
The warming was related to an eastward-moving warmer-than-average blob primarily located between 250 and 50 meters below the surface of the western Pacific Ocean… a downwelling Kelvin wave! As this wave sloshes east under the surface, it will continue to erode the supply of cooler-than-average waters available for La Niña, providing more confidence in the forecast for neutral conditions to develop this spring.
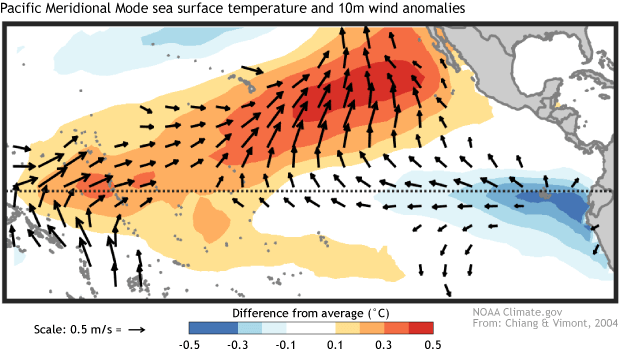
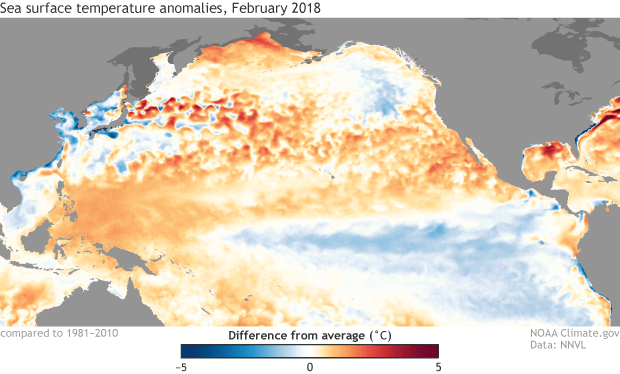
A while ago we were introduced to the Pacific Meridional Mode (PMM for short). In a nutshell, a positive PMM is a pattern of warmer-than-average sea surface temperatures stretching west from Baja California across the Pacific Ocean contrasted with cooler-than-average temperatures along the equator and into the southern hemisphere, just like the sea surface temperature patterns in the Pacific observed during February.
In fact, the Pacific Meridional Mode index is the most positive it’s been in years. The contrast between warmer north and cooler south can influence wind patterns along the equator, thereby influencing ENSO. Of course, the global climate system is big and complicated, and it’s too early to say if this strong PMM will be a major factor as the year goes on… but you can bet we’ll be watching it.
If you’d like to compare ocean temperature patterns from this year to the past, you can visit Climate.gov’s Data Snapshots; they also have a nice display of recent temperature and precipitation patterns. Another related NOAA resource is NOAA’s Environmental Visualization Lab (select “Add Data” then “climate”).