This post first appeared on the ENSO Blog and was written by Emily Becker
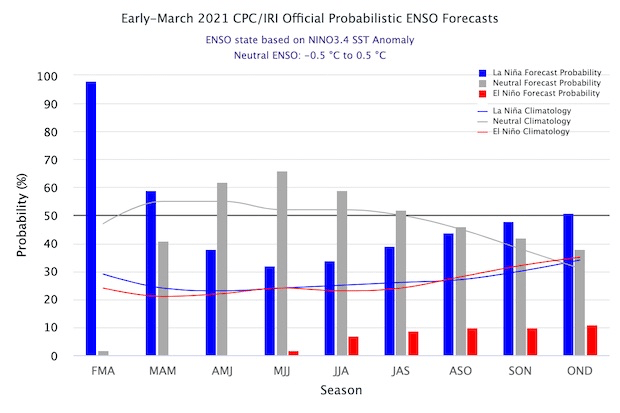
La Niña continues in the tropical Pacific, but it has weakened recently, and forecasters estimate about a 60% chance of a transition to neutral conditions in the late spring. Looking farther out into the fall of 2021, El Niño is unlikely to develop, and the chances of La Niña and neutral are similar.
Migratory birds
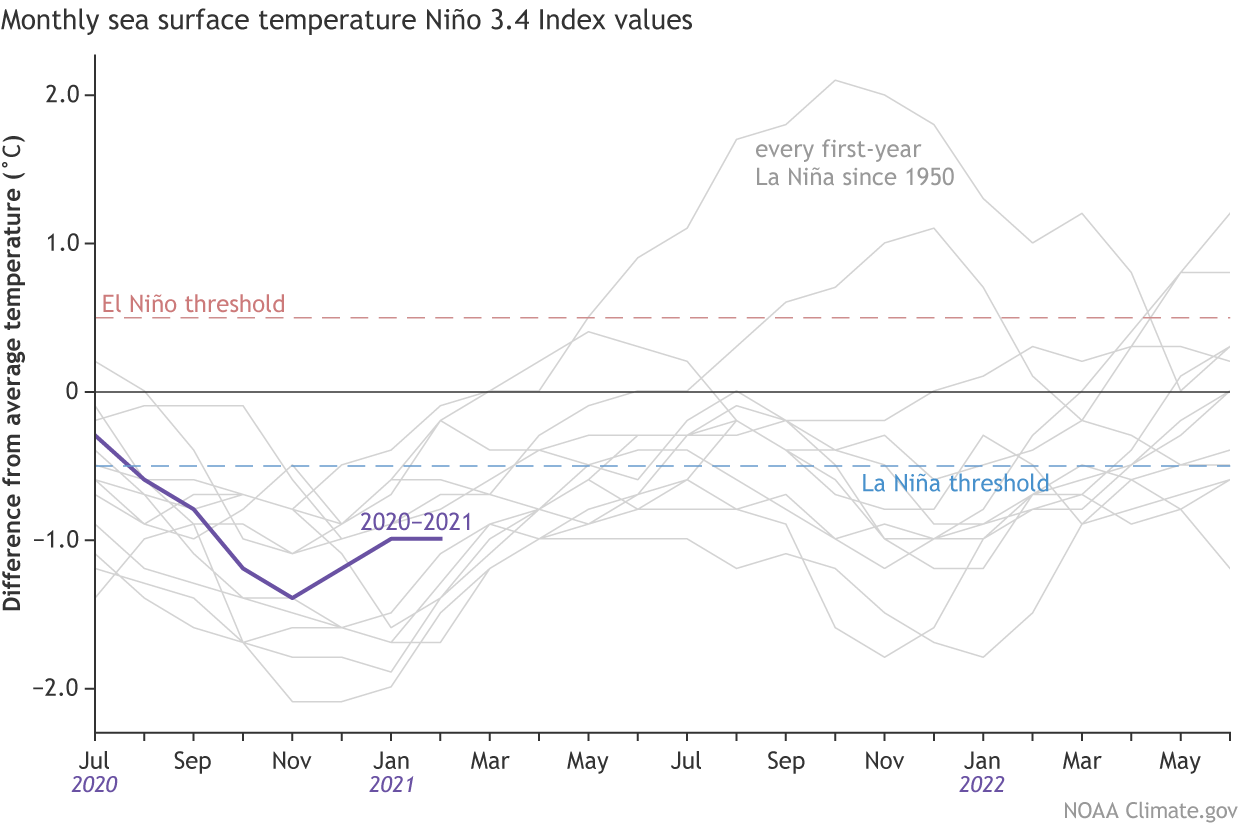
The February 2021 average sea surface temperature in the Niño3.4 region—our primary ENSO monitoring index—was just about the same as January, at about 1.0°C cooler than the 1991–2020 average, according to the ERSSTv5 dataset. (ICYMI: I covered the shift to the 1991–2020 average last month.) This comfortably exceeds the La Niña threshold of 0.5°C cooler than average.
Switching datasets so that we can see more recent activity, the weekly-updated OISST dataset shows an anomaly in the Niño3.4 index of about 0.7°C cooler than average last week. As Tom detailed in a post with my favorite title so far*, ERSSTv5 and OISST are different datasets with different methodologies, and they often show slightly different averages. OISST’s weekly updates can fluctuate and shouldn’t be used to judge things like how strong an ENSO event is. However, weekly updates, coupled with other observations, can give us an indication of what direction things are headed. In this case, signs are pointing to the Niño3.4 index moving closer to the long-term average.
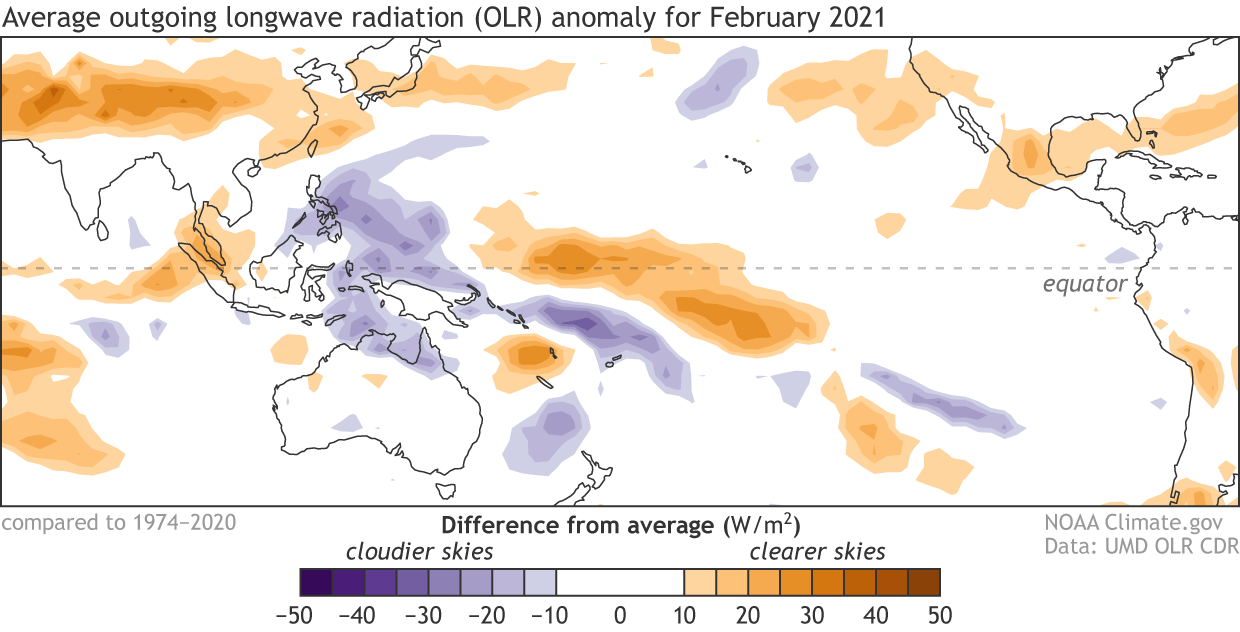
Speaking of other observations, atmospheric coupling (the atmospheric response to the changed sea surface temperatures, aka ENSO’s hallmark) weakened during February. The atmospheric pattern we expect during La Niña—less rain and clouds over the central Pacific and more over Indonesia—was still present, but reduced from earlier in the winter.
We keep a close eye on the temperature of the water under the surface of the tropical Pacific because the subsurface (approximately the upper 1,000 feet of the ocean) functions as a supply for the surface. The amount of cooler-than-average subsurface water diminished over February, a further indication that La Niña is likely to continue weakening.
Songbirds
Most of the computer models predict a transition to neutral by spring, and the weakening conditions in the tropical Pacific add confidence to those predictions. But what about later in the year? Long-range ENSO prediction is notoriously difficult this time of year, as we head into the spring predictability barrier. What is this barrier, you ask? In brief, computer model predictions made in the spring are less reliable than predictions made at other times of the year. There are a lot of things going on in the spring that make forecasting challenging, including that ENSO is often changing from one phase to another (e.g., from La Niña to neutral).
The spring barrier is contributing to the split in the forecast probabilities for later this year, with odds of about 40-45% for neutral and 45-50% for La Niña for the fall. Forecasters think El Niño is unlikely, with about a 10% chance of development by the early winter.
El Niño has only developed following a first-year La Niña twice in our historical record (1950–present), as you can see in the graph earlier in this post. We have a few months of spring barrier to go, but by June we may be able to get a clearer picture of how the rest of the year will look, ENSO-wise.
Waterfowl
Overall, this La Niña has been an odd duck. It developed following a neutral winter—the first time in the historical record that has happened. Also, a “typical” La Niña sea surface temperature pattern is generally symmetric across the equator, with regions of cooler-than-average surface temperatures extending north and south toward Central America and South America. For most of the winter, this La Niña had a clear region of cooler surface waters in the eastern Pacific south of the equator but lacked the mirrored signal north of the equator. This pattern did emerge somewhat during February, however.
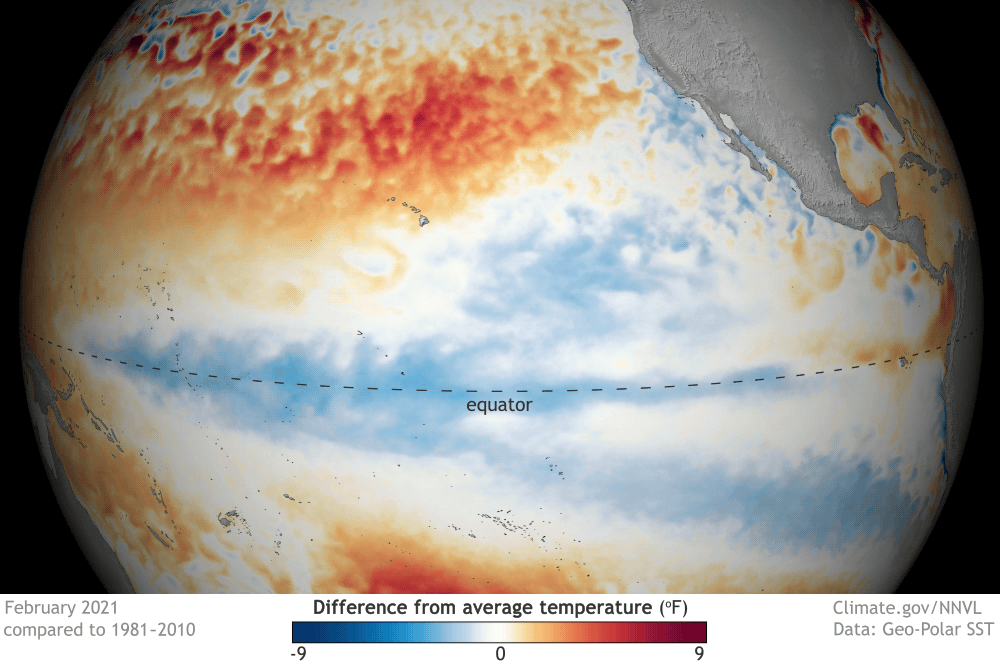
And, as Nat investigated last month, the jet stream pattern did not look very La Niña-y through much of the winter. This was despite the very clear La Niña patterns in the atmosphere and ocean across the tropical Pacific. One thing we can say with confidence is that La Niña 2020–21 will provide ENSO and climate researchers some interesting material.
Another thing we can say with confidence is that we’ll have our binoculars trained on the tropical Pacific so we can keep you updated on all things ENSO. And perhaps we’ll catch sight of a blue-footed booby or a wandering albatross.
* Not to diminish “Verification Part Two: Electric Boogaloo” or “Dearest Tao…”