NOAA: U.S. Winter Temperatures For Every El Niño Since 1950
By: Rebecca Lindsey
The tropical Pacific climate pattern known as “ENSO,” which is short for El Niño-Southern Oscillation, has its strongest influence on the U.S. climate during winter (December-February). El Niño in general acts to tilt the odds toward wetter- and cooler-than-average conditions across much of the South, and toward drier and warmer conditions in many of the northern regions. El Niño’s influence on temperature is less reliable than its influence on precipitation.
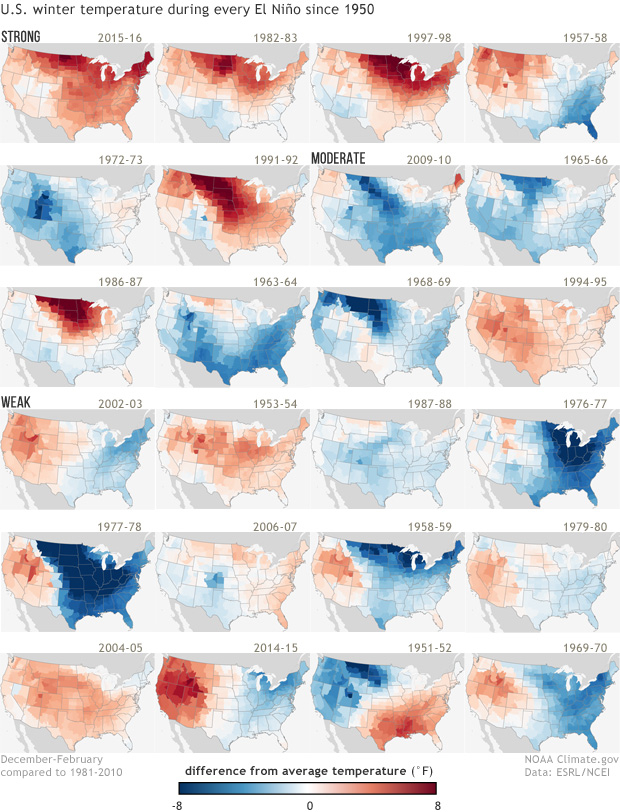
The collection of maps at right show the difference from average (1981-2010) winter temperature (December-February) in each U.S. climate division during all El Niño events since 1950. Years are ranked from strongest El Niño (top left) to weakest (bottom right)‚ based on the December–February Oceanic Niño Index value. There is no universal way to define the strength of El Niño events, but for this graphic, events with ONI values above 1.5 are ranked as strong, events with ONI values between 1 and 1.5 are ranked as moderate, and events with ONI values between 0.5 and 1 are ranked as weak.
These maps were first published on our ENSO blog as part of the 2015-16 winter outlook post by Mike Halpert, Deputy Director of NOAA’s Climate Prediction Center. They were updated for Halpert’s post about the 2018-19 winter outlook. In the original post, Halpert pointed out that compared to precipitation, temperature patterns are much less consistent, even during the strongest events.
Four of the six strong events have a warm signal that is nearly nationwide, but even among them, the geographic details—the location of the biggest anomalies, where the few cool spots are—vary from one event to another. Looking at both strong and moderate events, the patterns become even less consistent. Eight of the twelve events have a warm signal in the Northern Plains (a much smaller area than is affected in the strong events), but 4 are colder than normal.
This variability from one El Niño to the next is one reason why CPC scientists always talk about seasonal climate outlooks in terms of “odds,” “chances,” or “probabilities”—not guarantees. In the latest ENSO blog post, Halpert explains how the weak El Niño predicted for the 2018-19 winter factors into NOAA’s winter climate outlook, which favors warmer-than-normal temperatures across much of the country.