NOAA just released their official spring outlook for 2016 in the USA. In the video above, Big Mike explains everything going on in US weather, drought, and flood this Spring and the NOAA article below ads more.
The maps below show us more information on:
- Drought conditions
- Flood risk
- precipitation outlook
- temperature outlook
Top 5 Snowfall Totals in North America:
- Alyeska, AK = 721″
- Mt. Baker, WA = 571″
- Sugar Bowl, CA = 514″
- Crystal Mountain, WA = 487″
- Sugar Bowl, CA = 472″
This April Outlook Looks Good for:
- CA, NV, UT, WY, CO, WY, AZ, NM & southern ID. The only issue is going to be snow levels, but that isn’t abnormal, especially as we move into spring.
This April Outlook Looks Bad for:
- WA, OR, & northern ID where below average precipitation is forecast along with above average temperatures. That said, Baker in WA continues to get dumped on and has the 2nd most snow in North America and the 2nd deepest snowpack in North America. East Coast ski country has above average temps forecast along with equal chances for precipitation for most ski areas.
NOAA’s OFFICIAL SPRING OUTLOOK 2016:
by NOAA on March 16th, 2106
According to NOAA’s U.S. Spring Outlook released today areas of the country still under water from torrential rainfall last week have an elevated risk of moderate flooding through the rest of the season. Parts of Louisiana, Arkansas and eastern Texas have an elevated risk of moderate flooding, along with communities along the Mississippi and Missouri River basins and the southeastern United States, from Alabama to North Carolina. Surrounding areas are at risk of minor flooding this spring.
Spring flood risk

U.S. regions at risk for minor (light blue) and moderate (dark blue) flooding from April-June 2016. Large version shows Alaska, Hawaii, and Puerto Rico. NOAA Climate.gov map, based on NWS forecast.
NOAA hydrologists determine the spring flood risk based on environmental intelligence collected across the country, including late summer and fall precipitation, frost depth, soil saturation levels, stream flows, snowpack, temperatures and rate of snowmelt. This national assessment is a compilation of local threats evaluated by the National Weather Service’s 122 weather forecast offices and 13 river forecast centers. Contributing to the risk of flooding this spring, December 2015 was the wettest December on record for the contiguous United States, according to NOAA climate data.
“Our assessment of spring flood risk is based in large part on saturated soils and elevated streamflows from the Gulf Coast northward along the Mississippi River, although heavy rainfall at any time can cause local or regional flooding, even in places where the risk is currently considered low,” said Tom Graziano, Ph.D., acting director of NOAA’s National Water Center. “We encourage people to be prepared for the range of spring weather threats, including flooding, and tune into local forecasts to monitor their personal risk.”
Drought
Meanwhile, snowmelt and rain continue to improve drought conditions in northern California, while the rest of the state saw only a small benefit from recent precipitation fueled by a near-record El Nino, and remains in a persistent drought condition.
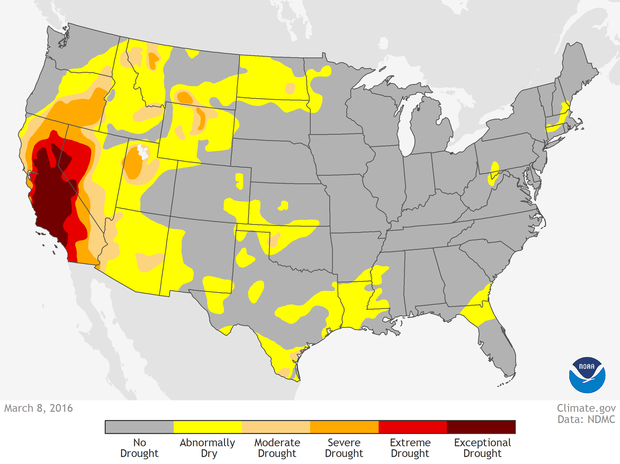
Drought conditions as of March 8, 2016. Large version shows Alaska, Hawaii, and Puerto RIco. Map by NOAA Climate.gov, based on data from the Drought Monitor project.
New drought is likely to develop this spring across most of Arizona and western New Mexico.
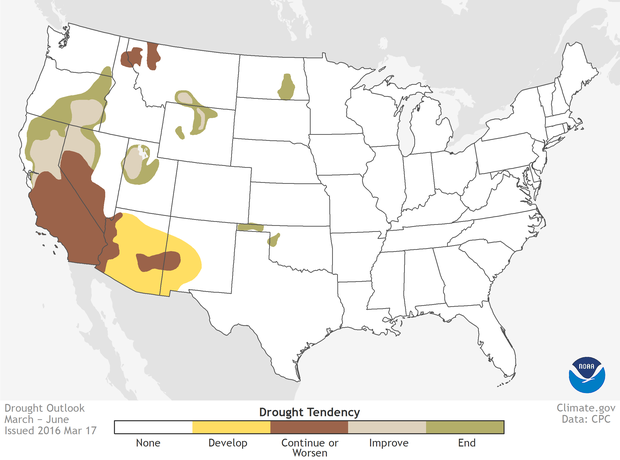
Seasonal drought outlook for the months of April-June 2016. Large version shows Alaska, Hawaii, and Puerto Rico. Map by NOAA Climate.gov, based on CPC data.
Temperature and precipitation
NOAA climate forecasters announced last week that El Niño conditions remain in place, but a weakening is forecast over the course of the spring months. However, El Niño continues to be a strong climate signal that will shape the nation’s weather this spring.
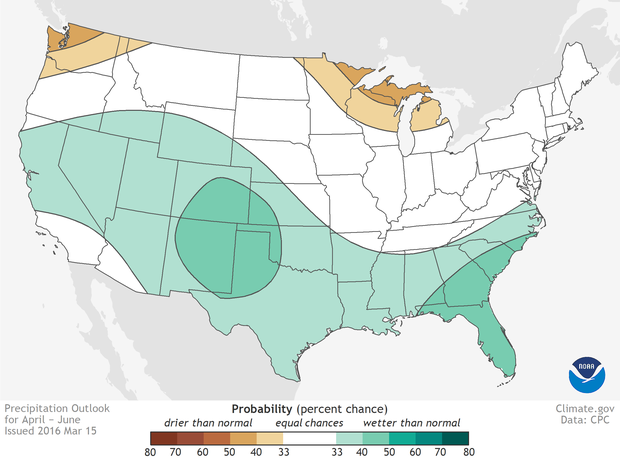
National precipitation outlook for April-June 2016. Large version shows Alaska, Hawaii, and Puerto Rico. Colors indicate the probability of above- or below-average precipitation, not how far above or blow average the precipitation is likely to be. White indicates equal chances for any outcome—above-, below-, or near-normal precipitation—not a prediction of “normal” conditions. Map by NOAA Climate.gov, based on data from the Climate Prediction Center.
For April through June, the U.S. Spring Outlook favors above-average precipitation across western Alaska, and the southern half of the country including most of California, the Southwest, the Gulf Coast and the Southeast. Below-average precipitation is favored around the Great Lakes, parts of the Pacific Northwest, the southern Alaska Panhandle and Hawaii. Most of the country, except the Central and Southern Plains, is favored to see above-average temperatures from April through June.
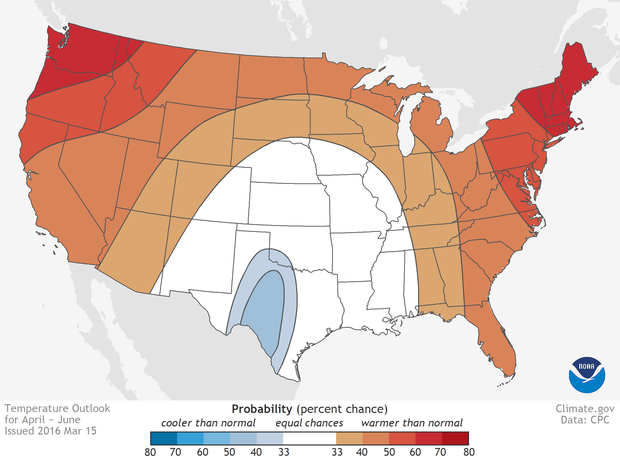
National temperature outlook for April-June 2016. Large version shows Alaska, Hawaii, and Puerto Rico. Colors indicate the probability of above- or below-average temperature, not how far above or blow average the temperature is likely to be. White indicates equal chances for any outcome—above-, below-, or near-normal temperature—not a prediction of “normal” conditions. Map by NOAA Climate.gov, based on data from the Climate Prediction Center.