
NOAA: Why Did It Rain So Much In California During Last Winter’s La Niña?
By: Tom Di Liberto
The title sort of says it all, doesn’t it? It rained a lot in California last winter. And it rained even though there was a La Niña present for part of the Northern Hemisphere winter, which normally leads to drier than average conditions. What the heck happened? This is a question we are still getting on social media a year later, which is why our editor asked the ENSO blog team to tackle it in its own post.

First off, if there is one topic that we here at the ENSO Blog have covered repeatedly, it’s that when it comes to specific climate impacts, especially for the United States, an El Niño or La Niña is a guarantee of absolutely nothing. Even so, we can use the state of ENSO as a “hint” of what may be in store. Sometimes hints work amazingly. And other times, not so much. The rainfall during last winter in California probably falls in that “not-so-much” category.
Flashback to 2016……………………………..
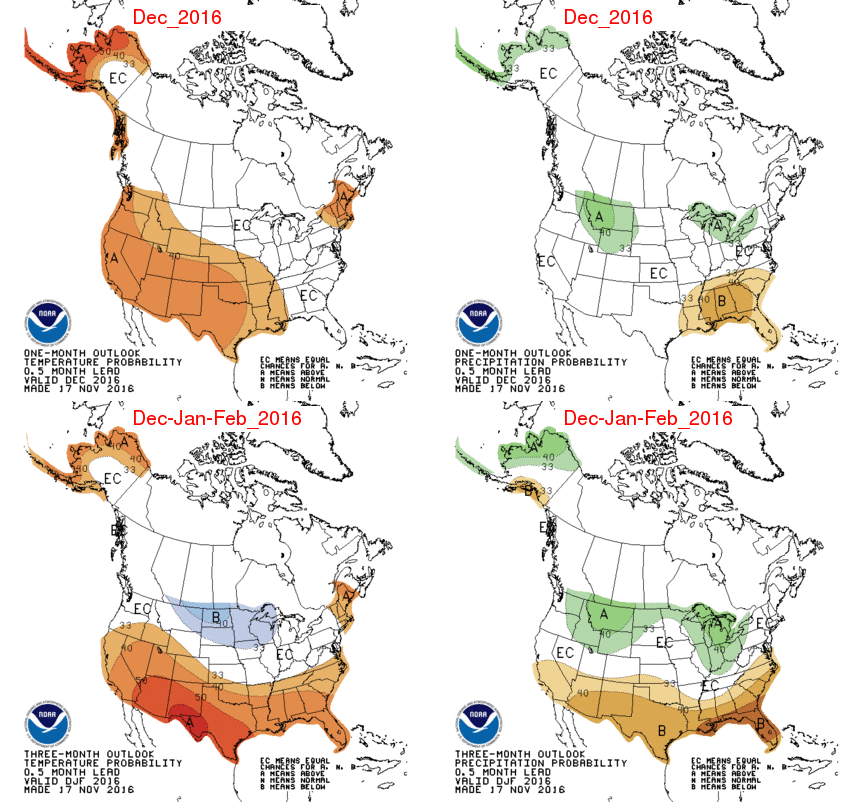
You can read exactly what we were thinking about ENSO right before the 2016-2017 winter here (1). The winter outlook for California, meanwhile, did not forecast a slam dunk for any outcome: it showed an increased chance of drier conditions in southern California and an equal chance of above, below or normal precipitation in northern California. It was a reasonable outlook given that La Niña suggests drier conditions in southern California.

That’s not how things, played out, though. California wasn’t just wetter than normal; it had its third-wettest year on record!
To give us a good look at how last year’s rainy winter played out across the state, I’ve taken weather station data from four major cities—San Francisco, Sacramento, Los Angeles and San Diego— and calculated a running accumulation of precipitation for the entire water year, starting on October 1 and ending on September 30 the next year.
The plot shows that up until the start of December 2016, the water year in both northern and southern California was looking pretty average, running only slightly above-average.
New year, new weather
Things simply got out of hand once the calendar turned over to 2017. During the months of January and February, San Francisco and Sacramento received almost a year’s worth of rain, skyrocketing the seasonal precipitation totals. Los Angeles and San Diego also observed a large increase in rainfall at the same time, although not as astounding as the totals farther north in the state.
By the end of the 2016-17 water year on September 30, the Sacramento station had received almost 34 inches of rain. It was the second wettest water year since 1950 with a total of 13.6 inches above average. San Francisco rainfall totals were 10 inches above average. Meanwhile in southern California, the numbers were not as large but still impressive. San Diego ended up 2.5 inches above average and Los Angeles 4 inches above the 1981-2010 average, both of which were roughly 25% higher than average.

Was this weird for a water year during a La Niña?
Normally, during a La Niña winter, conditions tend to be drier than average across southern California with a less clear signal for the northern half of the state. And we tend to be more confident in this tendency if the La Niña is strong.
During the 2016-17 winter, the La Niña was anything but strong. It was one of the weakest La Niña qualifying events on record. And it didn’t even last the entire winter, so it was one of the shortest too! Sea surface temperatures were near average, falling short of the La Niña threshold starting in January and were slightly above average by February.
With that said, it was still a remarkably wet winter for California during a La Niña. Looking at every water year since 1950, the 2016-17 water year was the second wettest overall and the wettest “La Niña” year in Sacramento, the wettest La Niña water year in San Francisco, and the second wettest La Niña water year in Los Angeles.

It might be a bit misleading, however, to label last year a “La Niña winter” as this La Niña quickly deteriorated at the beginning of 2017. If we instead relate the sea surface temperature anomalies in the equatorial Pacific during January to the water year total accumulation, it can be seen that besides Sacramento and San Francisco, the precipitation totals, while on the wetter side, were not extraordinary outliers in Los Angeles, and San Diego.
Of course, what also made the 2016-17 water year extraordinary is that most of this excess rainfall fell during only a few periods.

Storms slipping between the cracks
So, on the one hand, we could say that the lack of a dry outcome is not really surprising at all: last winter’s La Niña was a weak event and ocean conditions were rushing towards neutral during the winter. These types of short-lived, weak events tend to have a reduced influence on climate across the mid-latitudes.
Still, the atmosphere from December-February still looked pretty La Niña-like (see the schematic above for reference). There was a reduction of cloudiness (less precipitation) in the central Pacific and near Alaska, and an increase in rainfall activity over the Maritime Continent and parts of the West Coast in the United States. The only difference was that the area of the West Coast that is normally wetter than average was shifted slightly farther south than it normally is during La Niña.
But it’s important to remember that even if it was a significant La Niña, that doesn’t mean the seasonal average atmospheric pattern happens every day during the entire winter (2). And when that pattern weakens, anything can happen.
Leading into 2016, the atmospheric circulation over the North Pacific and North America was also looking pretty La Niña-like (3). But that pattern changed once the calendar moved into 2017. The largest rainfall event for northern California happened from roughly January 2-12. Surprisingly, the atmospheric pattern didn’t look too different from the La Niña pattern from a week prior. The high pressure in the North Pacific Ocean was still there, but it shifted a bit farther north and west. The Asian-Pacific jet stream position was retracted westward (as it tends to be during La Niña because of the higher than average pressures over the North Pacific that oppose west-to-east flow). But, the jet over North America had extended farther west than its typical position. And an atmospheric river event took place, dousing northern California (as explained here).

The next rain event, heaviest in southern California, happened just a few weeks later on January 18-23. The atmospheric pattern over the Pacific Ocean looked completely different and more like El Niño. Instead of a high pressure near Alaska, there was a broad area of low pressure. And instead of a retracted Asian-Pacific jet stream, the jet stream extended eastward, enhancing the west-to-east flow, all the way across the Pacific Ocean. This set-up effectively pointed an atmospheric fire hose at southern California.
Two soaking periods with two completely different set-ups managed to turn the “typical” La Niña winter on its head in January 2018 (3).
What about this year?
If last year showed you anything, it’s that it just takes a couple of rain events to turn a water year into one of the wettest ever (4). So far, with a stronger La Niña during this 2017-18 winter, California has been characteristically drier than average, despite a recent increase in rains during the middle of January. Taking a look at where things stand as of January 16, the recent rains have brought the water year closer to normal. However, if we look back at past history, most years this dry by this point have ended their water year with below-average precipitation in San Francisco, San Diego and Los Angeles, with more of a mixed bag in Sacramento. And the NOAA CPC seasonal forecast expects drier than average conditions to prevail.
Footnotes
(1) The forecast issued in November 2016 only had a 55% chance of La Niña remaining through mid-winter, and expected it to be pretty weak. This was not overwhelming odds, but more likely than any other option. In hindsight, the 2016-17 La Niña did not even make it through winter, with December-February sea surface temperature anomalies in the equatorial Pacific Ocean falling short of the -0.5C cut-off.
(2) In climate, you have to think about the long game. The reason La Niña has such an impact on the seasonal climate is because its influence can lead to more occurrences of certain patterns than normal. Imagine if by divine wish, you were granted a hat that when worn while playing blackjack increases the number of aces you receive. Over the course of the night, I bet that hat leads to you winning more money than you would have otherwise. However, if I showed up to see one or two single hands of blackjack, I very well could have seen you bust. The same holds true for La Niña, our atmospheric “hat”.
(3) There were also two extended rainy periods in February which contributed mightily towards the end of the year precipitation totals. These periods followed a similar pattern as those in January. The first period, roughly February 2-10, had atmospheric conditions similar to the first period in January, with a high-pressure near Alaska but displaced farther west than normal, and low pressure over northern California, which was displaced farther south than is normal during La Niña. The second period, February 16-21, was more like the later January period where atmospheric conditions looked nothing like La Niña. By this point, though, ocean temperatures in the Niño3.4 region were positive as ENSO was rapidly moving to neutral conditions. This meant that the influence of ENSO on California rains could have been minimal.
(4) This is one reason why it is so challenging for seasonal prediction for the West Coast. Compared with other regions of the United States, California receives a substantially higher fraction of its seasonal/water year precipitation from a small number of extreme events, typically atmospheric rivers. A few more or a few less atmospheric river events could mean the difference between a well above-average year and a dry one. For more nerdy info, check out this article by Dettinger et al. on atmospheric rivers, floods and water resources of California. http://www.mdpi.com/2073-4441/3/2/445