June 2017 ENSO update: pancake breakfast
A change is afoot! After months of suggesting an elevated chance for El Niño to develop, the CPC/IRI forecast has flattened out, and neutral conditions are expected (50-55% chance) to continue through the fall.
A recipe for neutral
In fact, the Nino3.4 region (a key ENSO monitoring area in the tropical central Pacific) is hovering around 0.5°C warmer than the long-term average. Yep, that’s the threshold for El Niño, but surely you remember that ENSO is a seasonal phenomenon, meaning those warmer sea surface temperatures need to stick around for several months—long enough to provoke an atmospheric response.
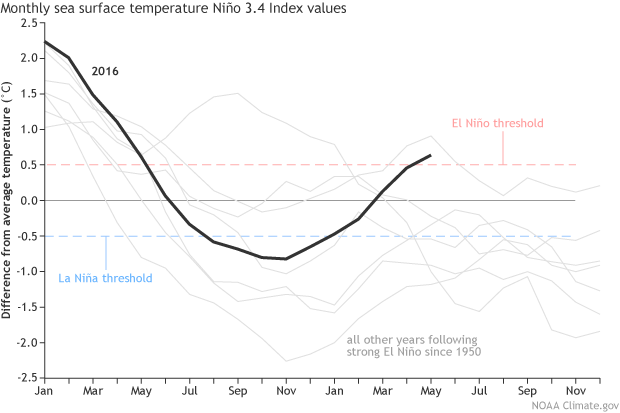
Monthly sea surface temperature in the Niño 3.4 region of the tropical Pacific compared to the long-term average for all years starting off from moderate-to-strong El Niño since 1950, showing how 2016 (blue line) compares to other events. Climate.gov graph based on ERSSTv4 temperature data.
Despite the warmer sea surface temperatures, the atmosphere is not behaving like El Niño. During May, the indicators that we track looked very average, including both the upper-level and near-surface winds over the equatorial Pacific and the amount of rain and cloudiness in the central Pacific and Indonesia. The indexes that measure the difference in the atmospheric pressure between the central Pacific and the far western Pacific, the Southern Oscillation Index and the Equatorial Southern Oscillation Index, were both close to zero in May, indicating, again: neutral conditions.
Most of the recent forecast models predict that the Niño3.4 region will move closer to average temperatures over the next few months. The average of all the dynamical model forecasts in the North American Multi-Model Ensemble flattens out at slightly above the long-term mean for the rest of this year. Averaging all model forecasts together usually produces the best forecast, because it reduces the noise and highlights the signal. Stay tuned—next month, I’m writing a post all about computer climate models. (Try to contain your excitement!)
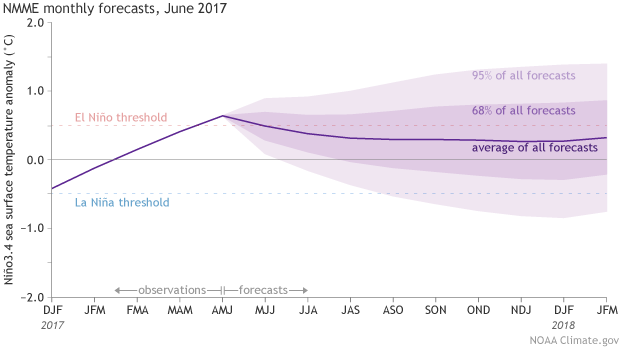
Climate model forecasts for the Niño3.4 Index, from the North American Multi-Model Ensemble (NMME). Darker purple envelope shows the range of 68% of all model forecasts; lighter purple shows the range of 95% of all model forecasts. NOAA Climate.gov image from CPC data.
Combine these neutral atmospheric conditions, cooling forecasts, and the lack of any substantial warmth under the surface of the Pacific, and you get the current forecast of an approximately 50-55% chance of continuing neutral conditions through the fall.
If you can’t stand the heat…
One of the key ways we measure ENSO uses the temperature anomaly in the central tropical Pacific, meaning the difference from the long-term average. So, for example, the 2015-16 El Niño peaked during November–January, when the seasonal Oceanic Niño Index was 2.3°C (around 4°F) above average. But what exactly is average? Like most things having to do with weather & climate, it’s not so simple.
“Average” for the Oceanic Niño Index is based on the most recent 30-year period, updated every 5 years. So right now in 2017, “average” is defined by the 1986-2015 period. Meaning, to get the March–May 2017 Oceanic Niño Index, we would first calculate the average sea surface temperature during March–May over the 30 years from 1986-2015: 27.7°C (81.9°F). Then we’d subtract that from the March–May 2017 temperature, which was 28.1°C (82.6°F), yielding an anomaly of 0.4°C (0.7°F).
In 2021, the average period will be updated to 1991-2020. We update this 30-year period every five years because the temperature in the central Pacific, just like most of the rest of the world, has been increasing due to human-caused climate change. (Some resources on climate change: climate.gov, NOAA, NASA, IPCC.)
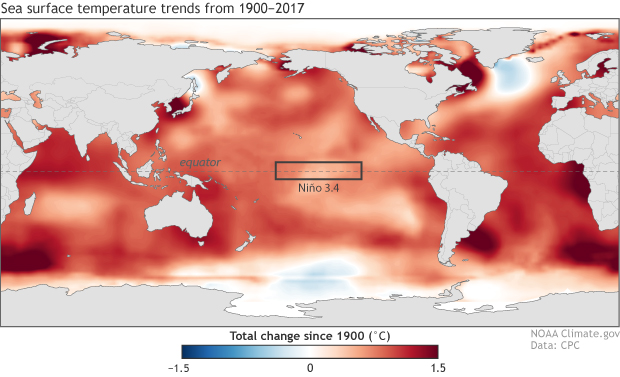
Change in sea surface temperature since 1900, using ERSSTv4. Map by climate.gov from CPC data.
The temperature in the Niño3.4 region hasn’t warmed quite as fast as much of the rest of the planet, but still has increased around 0.5-0.75°C (0.9 – 1.35°F) since the beginning of the previous century. The warming trend over the past 50 or so years is even steeper than that starting in 1900.
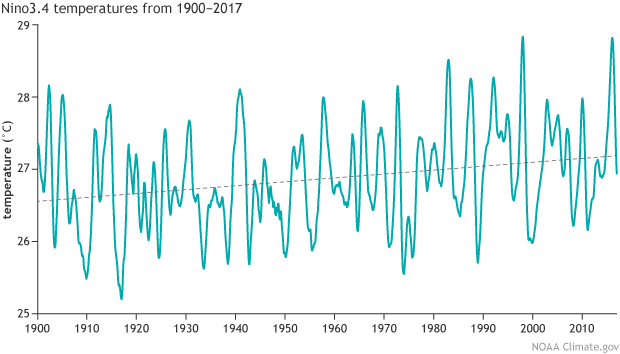
Temperature in the Niño3.4 region (5°S – 5°N latitude, 170°W – 120°W longitude) since 1900, using ERSSTv4 data. A 12-point running average has been applied to the monthly temperatures. Dashed line shows the 1900 – 2017 trend. Climate.gov graphic from CPC data.
By updating our reference for comparison, we can remove most of the warming trend from the temperatures. If we used only one base period (for example, 1971-2000) from when the ocean was cooler overall, the trend would more clearly affect our ability to reach El Niño and La Niña thresholds (in effect, leaving the trend in would make it easier to achieve El Niño and harder to achieve La Niña). There’s more information about this method of trend removal here.
This trend in SSTs poses a problem because there’s a lot more to ENSO than just the temperature of the Nino3.4 region. For example, the temperature gradient (change with distance) across the tropical Pacific is critical to driving the system. ENSO also requires changes in the atmosphere, and there are no associated trends in the Southern Oscillation Index, for example. Identifying a way to distinguish the strength and variability of ENSO events in a warming world is an active area of research by some of the top climate scientists.
A couple of years ago, Tom wrote a great post about ENSO and climate change. The punchline to that post is that while researchers are confident that ENSO will continue to happen (as it has for many thousands of years), we’re not sure exactly how ENSO itself will be affected by climate change. Add that to the challenge of just seeing the trees for the forest, and we have a lot on our plate!