No, the current El Nino is not the strongest on record, yet. Media outlets reporting that are incorrect. NOAA won’t be able to tell if this is the strongest on record until February 2016 when the November, December, and January sea surface averages have been recorded and compared to other El Nino years. On average, the current El Nino wasn’t as strong as the 1997 El Nino the past 3 months.
“The Niño3.4 ERSSTv4 for September–November is 2.04°C, second to 1997’s 2.18°C.” – NOAA, today

NOAA’s El Nino update today is basically just telling us that the current strong El Nino will last through the winter and that the ocean should return to normal temperatures beginning in late spring, early summer.
For more information, please read NOAA’s article below.
EL NIÑO/SOUTHERN OSCILLATION (ENSO) DIAGNOSTIC
DISCUSSION
issued by
CLIMATE PREDICTION CENTER/NCEP/NWS
and the International Research Institute for Climate and Society
10 December 2015
ENSO Alert System Status: El Niño Advisory
Synopsis: El Niño is expected to remain strong through the Northern Hemisphere winter 2015-16, with a transition to ENSO-neutral anticipated during late spring or early summer 2016.
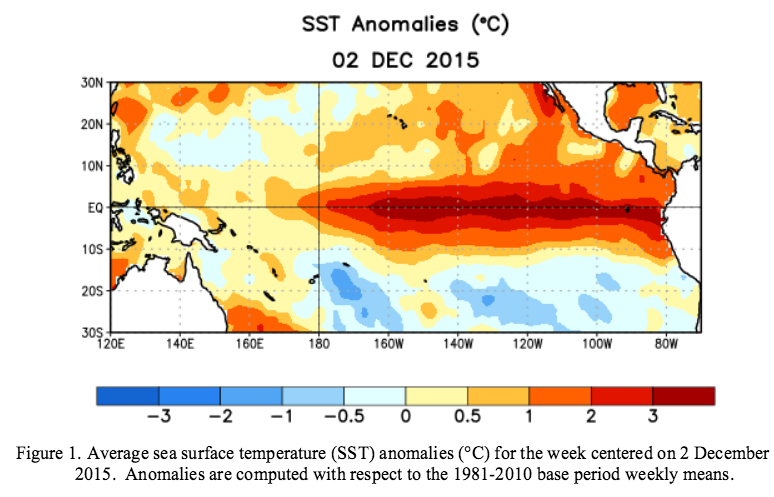
A strong El Niño continued during November as indicated by well above-average sea surface
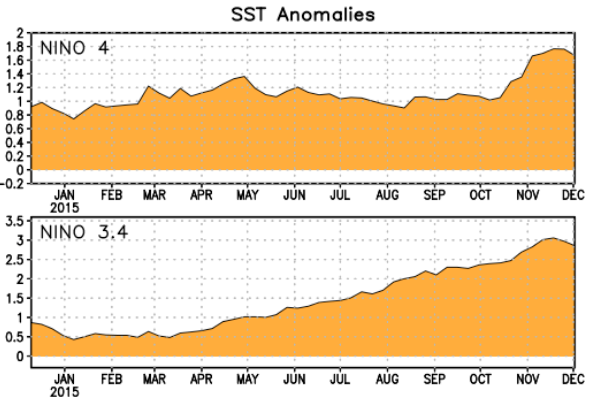
temperatures (SSTs) across the central and eastern equatorial Pacific Ocean (Fig. 1). The Niño-4, Niño-
3.4 and Niño-3 indices rose to their highest levels so far during this event, while the Niño-1+2 index
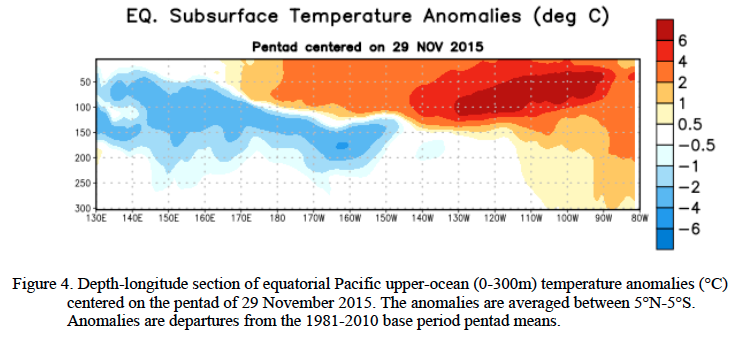
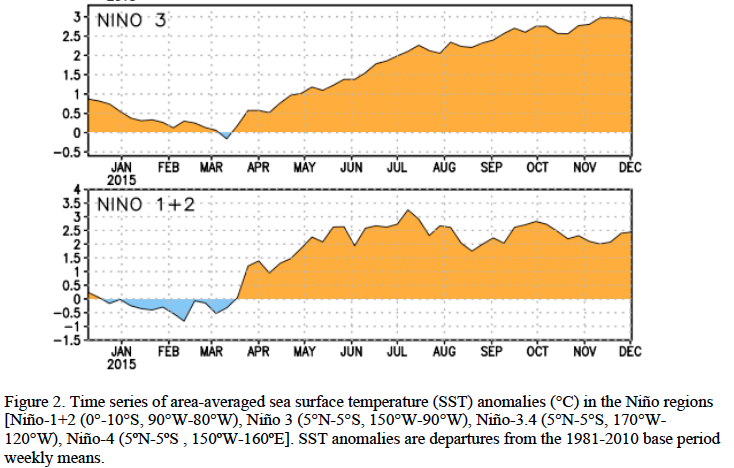
remained approximately steady (Fig. 2). The subsurface temperatures in the central and eastern Pacific,
while still well above average, decreased slightly (Fig. 3) due to the eastward push of the upwelling phase
of an equatorial oceanic Kelvin wave (Fig. 4). Low-level westerly wind anomalies and upper-level
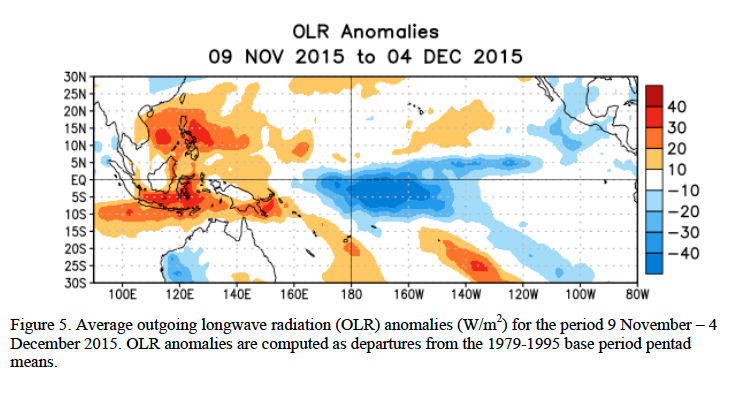
easterly wind anomalies continued over the most of the tropical Pacific. The traditional and equatorial
Southern Oscillation Index (SOI) values remained negative. These conditions are associated with
enhanced convection over the central tropical Pacific and suppressed convection over Indonesia (Fig. 5).
Collectively, these atmospheric and oceanic anomalies reflect a strong El Niño episode that has matured.
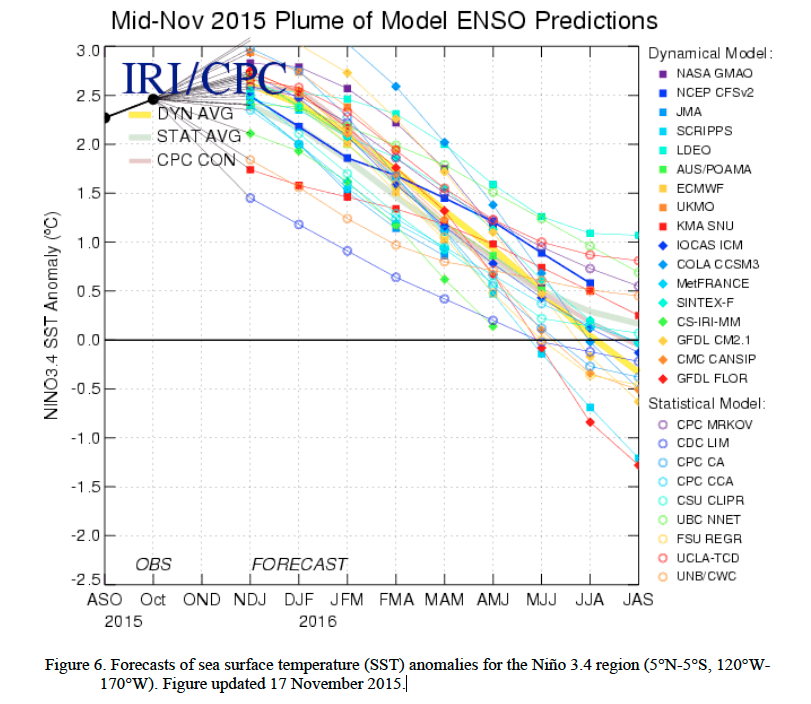
Most models indicate that a strong El Niño will continue through the Northern Hemisphere winter
2015-16, followed by weakening and a transition to ENSO-neutral during the late spring or early summer
(Fig. 6). The forecaster consensus remains nearly unchanged from last month, with the expectation that
this El Niño will rank among the three strongest episodes as measured by the 3-month SST departures in
the Niño 3.4 region dating back to 1950. El Niño is expected to remain strong through Northern
Hemisphere winter 2015-16, with a transition to ENSO-neutral anticipated during the late spring or early
summer 2016 (click CPC/IRI consensus forecast for the chance of each outcome for each 3-month
period).
El Niño has already produced significant global impacts and is expected to affect temperature and
precipitation patterns across the United States during the upcoming months (the 3-month seasonal outlook will be updated on Thursday December 17th). Seasonal outlooks indicate an increased likelihood of
above-median precipitation across the southern tier of the United States, and below-median precipitation
over the northern tier of the United States. Above-average temperatures are favored in the West and
northern half of the country with below-average favored in the southern Plains and along the Gulf Coast.