NOAA is saying that there is an 85% chance that the current El Nino will last into the 2015/16 North American winter. They are now also saying that they favor a “Strong” El Nino for winter 2015/16.
“NOAA CPC/IRI forecasters are now very confident that the event will continue through the fall (over 90% chance) and into the winter (~85% chance).” – NOAA
“…forecasters currently favor a “strong” event for the fall/early winter.” – NOAA
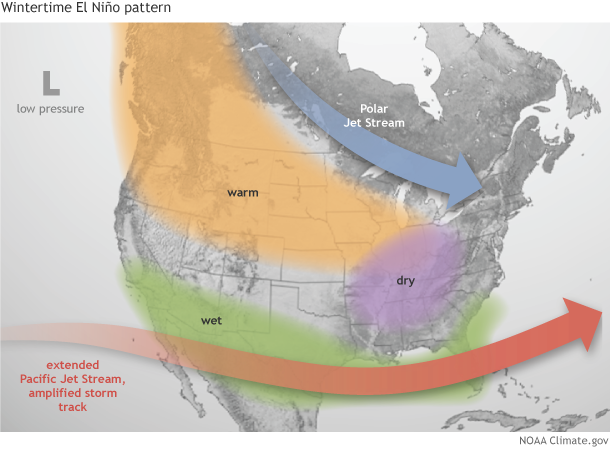
Strong El Nino events are easier to predict than weak or moderate ones. In a strong El Nino North American winters can expect more precipitation on the West Coast and Southwest along with drier/warmer conditions in the Pacific Northwest. Two lousy PNW winters in a row? We hope not…
“El Niño events affect the strength and position of the jet stream, and tilt the odds toward more rain than average along the West coast and in the Southeast during the winter.” – NOAA
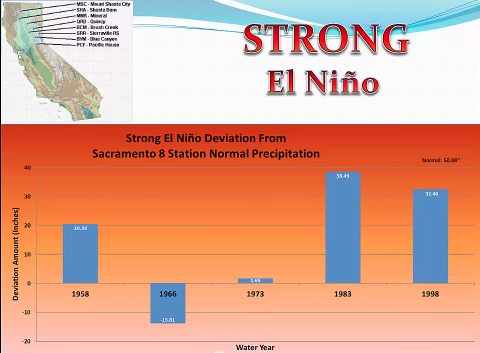
In California, 4 of the past 5 Strong El Nino events have lead to above average precipitation.
June El Niño update: Damn the torpedoes, full speed ahead
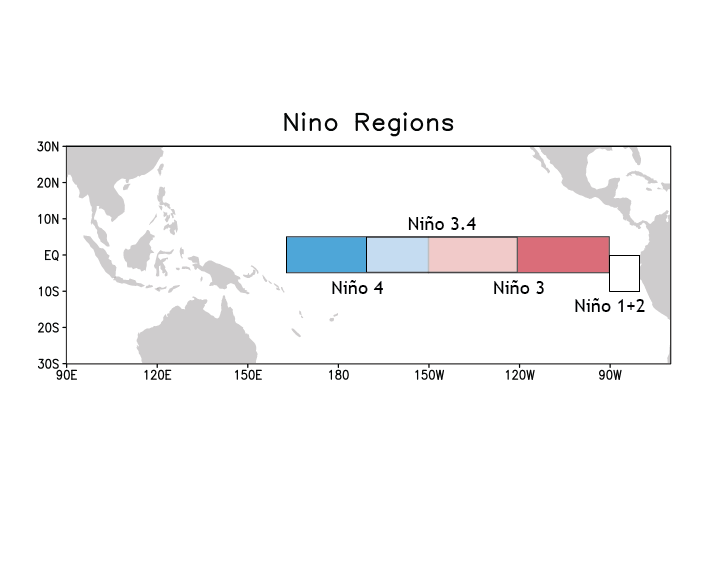
El Niño continues to pick up steam. NOAA CPC/IRI forecasters are now very confident that the event will continue through the fall (over 90% chance) and into the winter (~85% chance). Now that we’re emerging from the spring barrier, this month’s update provides a first guess of the potential strength of El Niño. It’s harder to predict the strength of the event than it is to predict its duration, so we are less confident about that, but forecasters currently favor a “strong” event for the fall/early winter. By “strong” we mean it’s expected that the three-month average sea surface temperature in the Niño3.4 region will peak at more than 1.5°C (2.7°F) above normal.
What’s happening right now?
During the month of May, we saw increases in a lot of the ENSO indicators. Sea surface temperature anomalies (the departure from average) were up all across the tropical Pacific, and the most recent Niño3.4 Index was 1.2°C. Both the lower-level and upper-level winds along the equator were substantially weaker than average last month, characteristic of El Niño’s weakenedWalker Circulation. This feedback between the higher sea surface temperature anomalies and the atmosphere is critical to both perpetuating and strengthening an El Niño event, and to communicating the effects of El Niño to other areas of the globe.
Signs of another downwelling Kelvin wave have begun to appear in the upper levels of the equatorial Pacific. This reinforcing source of warmer-than-average waters follows the strong Kelvin wave that has been slowly moving east since February. The consistently warmer waters are reflective of the slower changes we’d expect to see when the ocean-atmosphere system has settled into an ENSO event, as opposed to the shorter-term changes that dominate the rest of the time.

Hovmoeller plot showing the changes in upper-ocean heat content over the past year. The vertical axis shows time, starting in June 2014 (top) and going through June 2015 (bottom). Horizontal axis spans the equatorial Pacific Ocean, from 130°E to 80°W. Each row in the plot is the average temperature anomaly of the upper 300 m. For example, the last Kelvin wave (area of warmer-than-average waters) develops near the Date Line in March, and slowly moves eastward through time. For more on how to interpret these graphs, check out Tom’s post. CPC figure.
What signs are suggesting a possible strong event?
The physical observations I described above are a source of confidence that this event is continuing to build. Also, most climate models are forecasting a continued increase in Niño3.4 sea surface temperature anomalies, and many forecast a peak in the early winter above 1.5°, some above 2.0°C.

Climate model forecasts for the Niño3.4 Index, from the North American Multi-Model Ensemble (NMME). Darker purple envelope shows the range of 65% of all model forecasts; lighter purple shows the range of 98% of all model forecasts. NOAA Climate.gov image by Fiona Martin from CPC data.
It’s important to remember, though, that we only have a handful of strong El Niño events in the historical record—seven since 1950. And only three of those saw Niño3.4 index values of 2.0°C or higher: 1972-73, 1997-98 and 1982-83)*. Imagine if we’d only had seven hurricanes in the history of record-keeping; it would make it much harder to understand and predict how a future hurricane could develop. So, while we’re confident that this El Niño event will continue, there’s still plenty of uncertainty about how it will evolve.
That said… what would a strong event mean?
As Tony pointed out in our last post, ENSO impacts on North American weather and climate are most noticeable in the winter. This is largely because winter weather is governed more by large-scale processes (e.g. nor’easters) than summer weather, when local effects (e.g. isolated thunderstorms) tend to be more important. El Niño events affect the strength and position of the jet stream, and tilt the odds toward more rain than average along the West coast and in the Southeast during the winter.
El Niño loads the dice in favor of certain impacts, but it doesn’t guarantee them. However, stronger events tend to lead to more predictable effects. My brother asked me if he should repair the leaks in the roof of his campervan before he goes to Florida this winter… based on the ENSO forecast, I said yes. (I would probably have said yes anyway —who wants to stay in a drafty camper?— but that’s beside the point.)

Changes in the winter atmosphere during El Niño. NOAA Climate.gov image by Fiona Martin.
Globally, this El Niño event is likely to lead to higher global temperatures, possibly record-breaking. On this, check out Deke Arndt’s post on our new sister blog, Beyond the Data. Also, as I mentioned last month, the tropical Pacific hurricane season is already breaking records, while theAtlantic hurricane season is forecast to be quieter than average—both effects linked to El Niño. For the coming summer (June-August), check out Tony’s post on potential temperature and precipitation impacts linked to El Niño.
Many, many different components are at work in the global climate system, making exact predictions impossible. However, the development of a climate phenomenon like El Niño can make some outcomes more likely than others, which is why we follow it so closely. We’ll keep you posted as this event continues.
Outside of the United States, which areas will be benefited by El Nino…or is that a phenomenon unique to North America?
So, Big White and Whitefish, more 40 and 50 degree weather in February? And if it’s warm so far north is it fair to assume that it will be warm south of there as well? Warmer? It’s south after all…another year I won’t get to experience Utah for my first time. At least it appears the northeast, where I live, will be ridiculous cold again…the snow they do get will stay nice longer again? Map looks like a repeat of last year.