This post first appeared on climate.gov and was written by Jessica Blunden
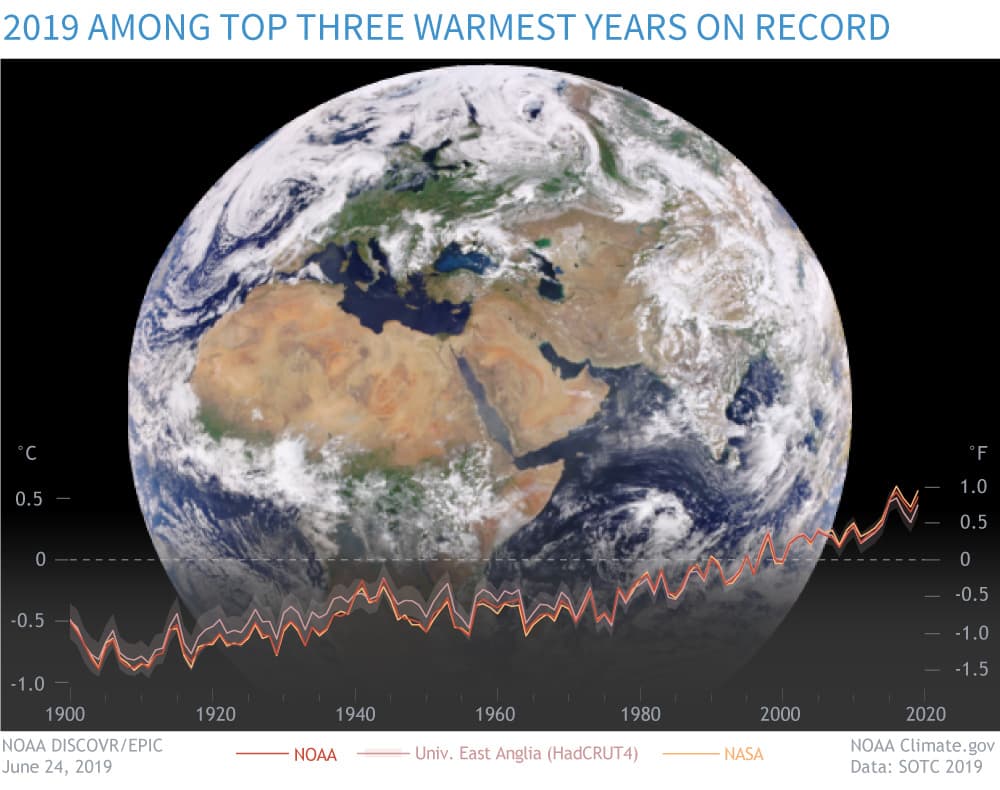
A new State of the Climate report confirmed that 2019 was among the three warmest years in records dating to the mid-1800s with a short-term warming, but weak, El Niño influence early in the year.
The report found that the major indicators of climate change continued to reflect trends consistent with a warming planet. Several markers such as sea level and greenhouse gas concentrations in the atmosphere once again broke records set just one year prior.
These key findings and others are available from the State of the Climate in 2019 report released online today by the American Meteorological Society (AMS).
The 30th annual issuance of the report, for which NOAA National Centers for Environmental Information serves as lead editor, is based on contributions from more than 520 scientists from over 60 countries around the world and reflects tens of thousands of measurements from multiple independent datasets (full report). It provides a detailed update on global climate indicators, notable weather events and other data collected by environmental monitoring stations and instruments located on land, water, ice, and in space.
The report’s climate indicators show patterns, changes, and trends of the global climate system. Examples of the indicators include various types of greenhouse gases; temperatures throughout the atmosphere, ocean, and land; cloud cover; sea level; ocean salinity; sea ice extent and snow cover.
Report highlights include these indications of a warming planet
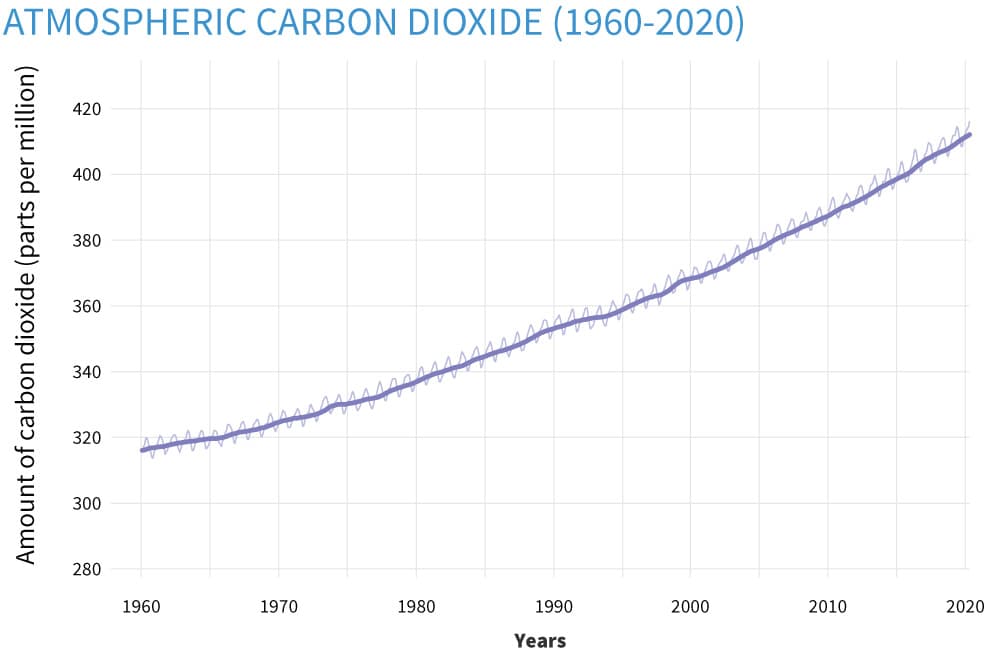
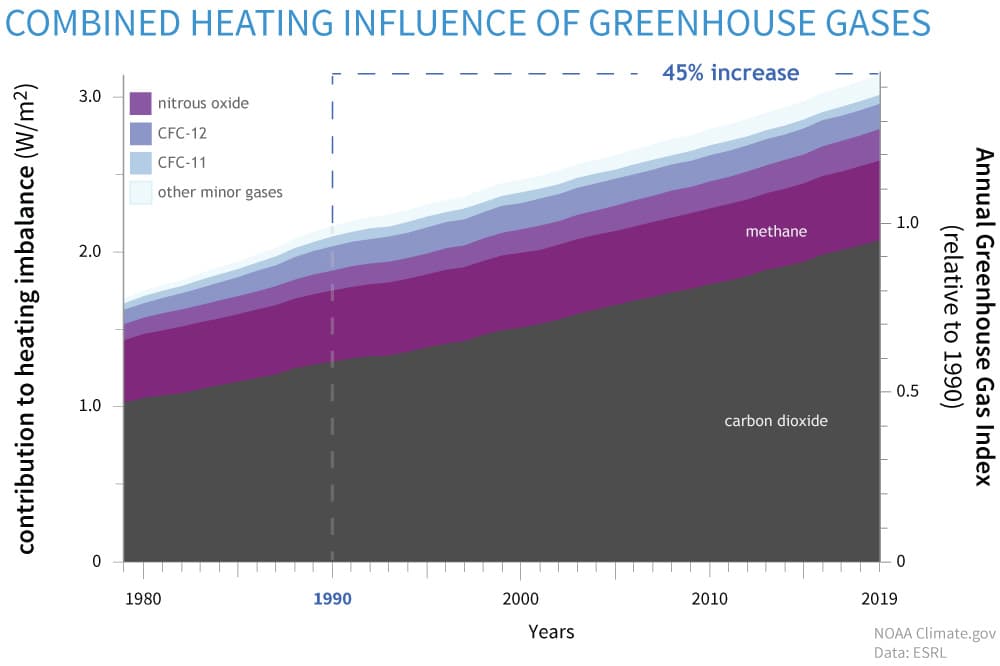
Greenhouse gases were highest on record. As they do each year, the major greenhouse gas concentrations, including carbon dioxide (CO2), methane and nitrous oxide, rose to new record high values during 2019.
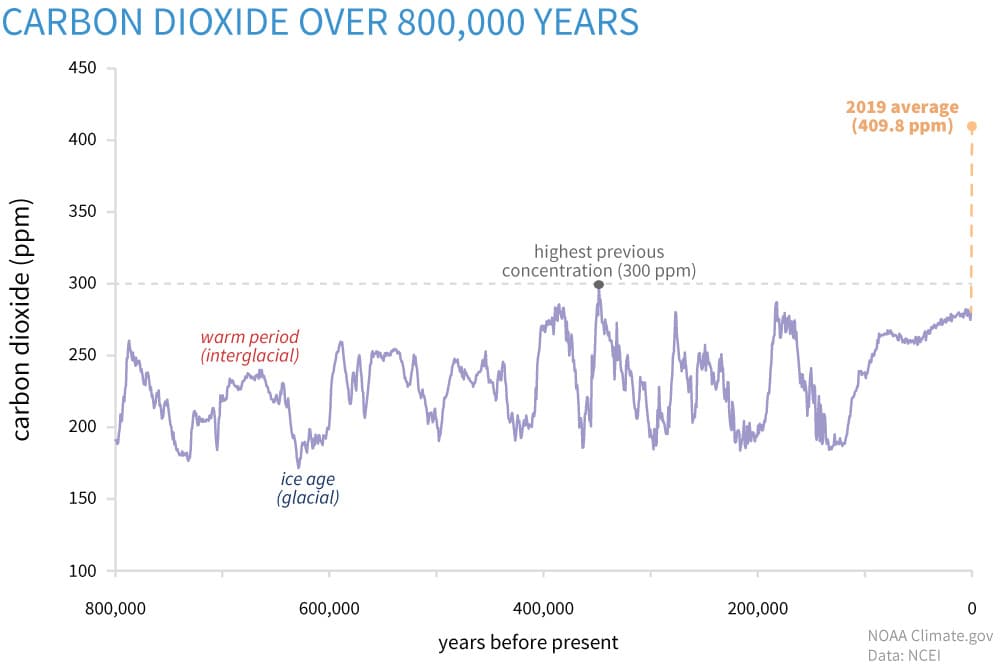
The global annual average atmospheric CO2 concentration was 409.8 parts per million (ppm). This was 2.5 ppm greater than 2018 amounts and was the highest in the modern 61-year measurement record and in ice core records dating back as far as 800,000 years.
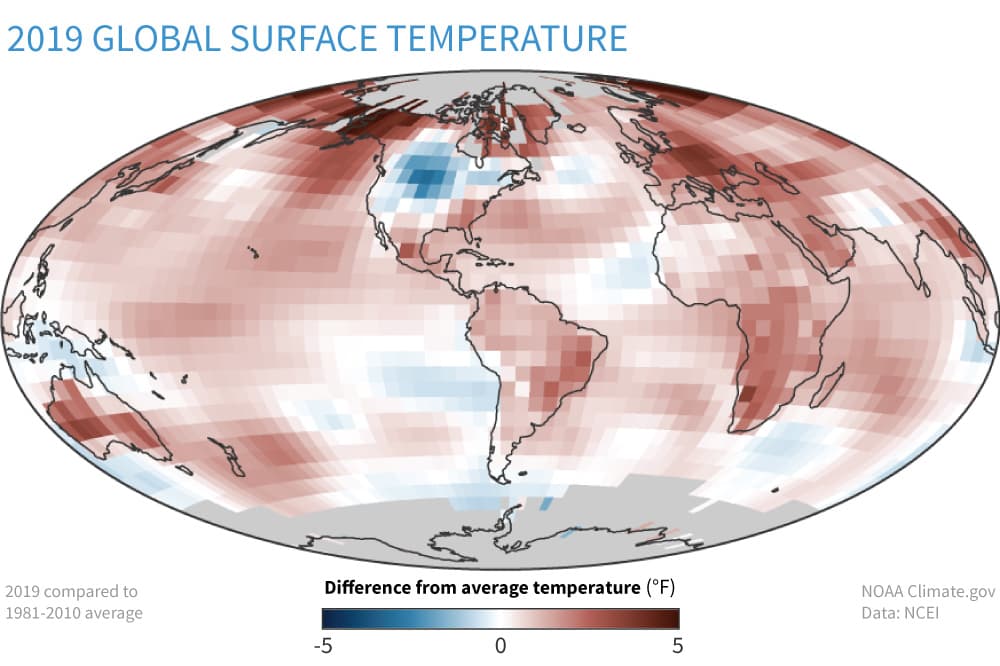
Global surface temperatures were near-record high. Annual global surface temperatures were 0.79°–1.00°F (0.44°–0.56°C) above the 1981–2010 average, depending on the dataset used. This places 2019 among the three warmest years since records began in the mid- to late 1800s. July was the hottest month in records dating to the mid- to late 1800s. The six warmest years on record have all occurred in the past six years, since 2014. Each decade since 1980 has been warmer than the preceding decade, with the most recent (2010–19) being around 0.2°C warmer than the previous (2000–09).
Atmospheric temperatures were record or near-record setting. In the region of the atmosphere just above Earth’s surface, the globally averaged annual lower troposphere temperature was third highest to record high and, in the layer above that, the lower stratosphere temperature was third lowest to record low, depending on the dataset used. Even higher in the atmosphere, middle- and upper-stratospheric temperatures were lowest on record since satellite records began in 1979.
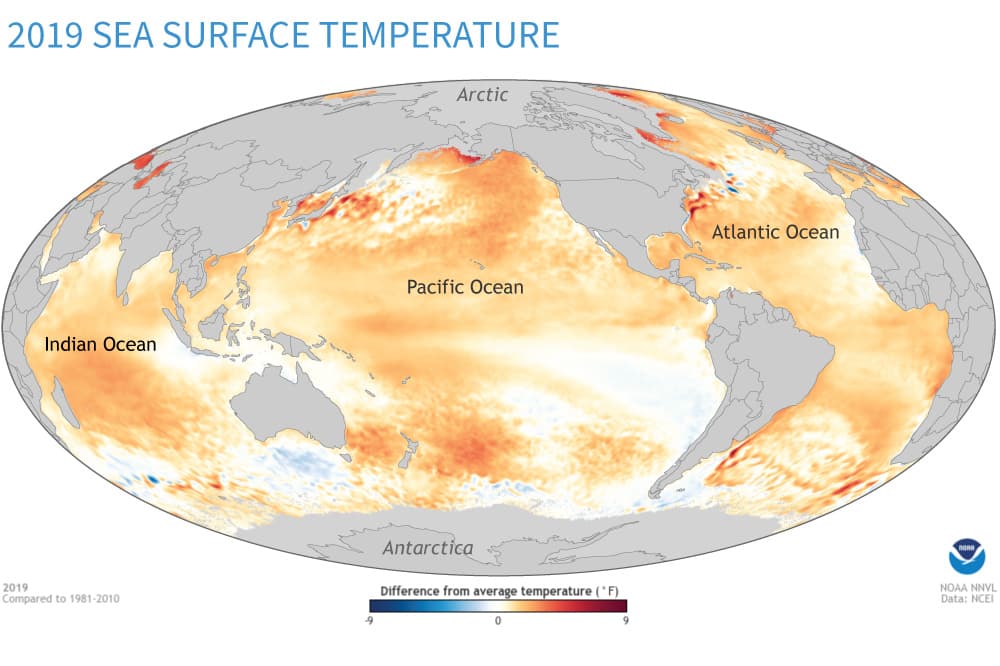
Sea surface temperatures were near-record high. The globally averaged 2019 sea surface temperature was the second highest on record, surpassed only by the record El Niño year of 2016.
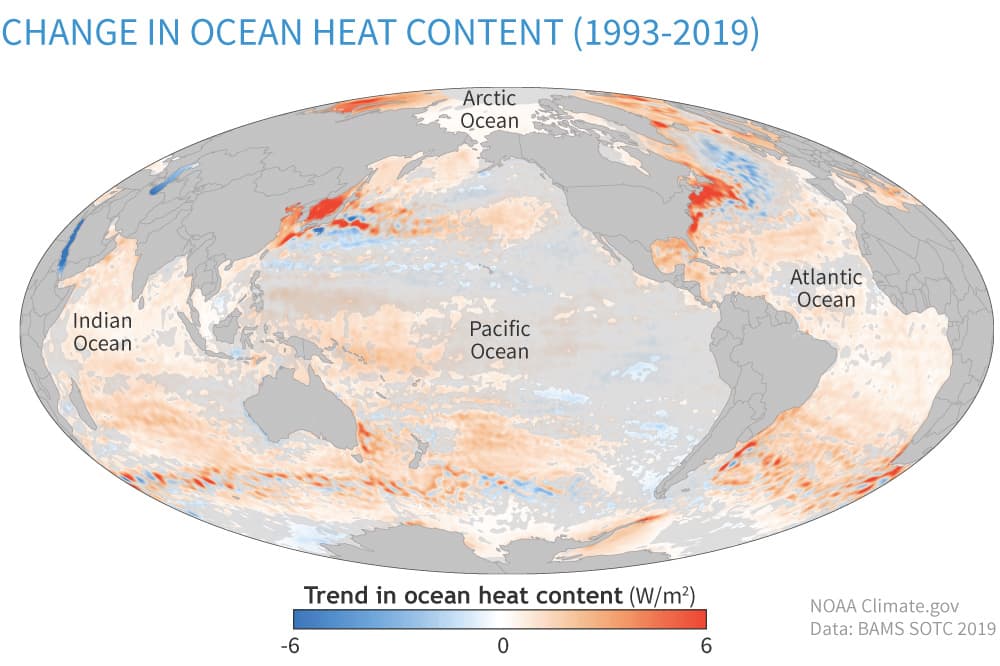
Global upper ocean heat content was record high. Globally, upper ocean heat content reached record highs in 2019 both in the upper layer measured from the surface to 700 meters. This record heat reflects the continuing accumulation of thermal energy in the top 2,300 feet (700 m) of the ocean. Ocean heat content was also record high in the deeper layer beneath, from 700 to 2000 m depth. The ocean absorbs more than 90% of Earth’s excess heat from global warming.
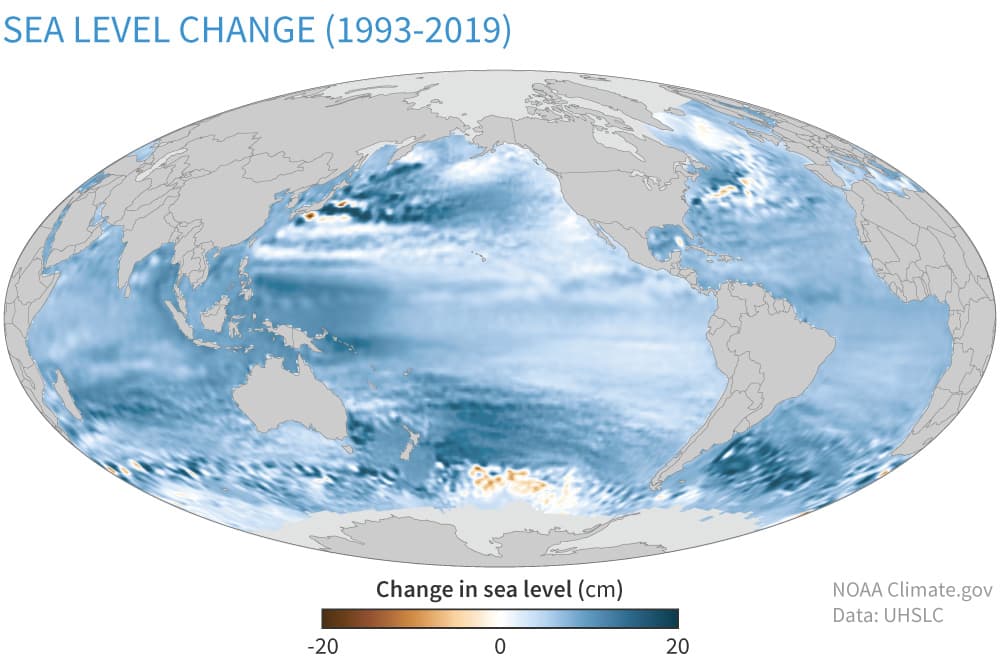
Global sea level was highest on record. For the eighth consecutive year, global average sea level rose to a new record high and was about 3.4 inches (87.6 mm) higher than the 1993 average, the year that marks the beginning of the satellite altimeter record. This rise represents an increase of 6.1 mm from 2018. Global sea level is rising at an average rate of 1.3 inches (32 mm) per decade. Melting of glaciers and ice sheets, along with warming oceans, account for the trend in rising global mean sea level.
Oceans absorbed a record amount of carbon dioxide, and pH levels continue to decrease. The ocean absorbed about 2.4 billion metric tons more carbon dioxide than it released in 2019. This is a record high amount and an increase of 0.2 petagrams from 2018, continuing a trend that began at the start of the 21st century. As a consequence of the increased oceanic carbon dioxide, surface ocean pH has declined, or become more acidic, by 0.018 ± 0.004 units per decade in most of the ocean since the pre-industrial period, particularly in colder water.
The report also documents key regional climate and climate-related events.
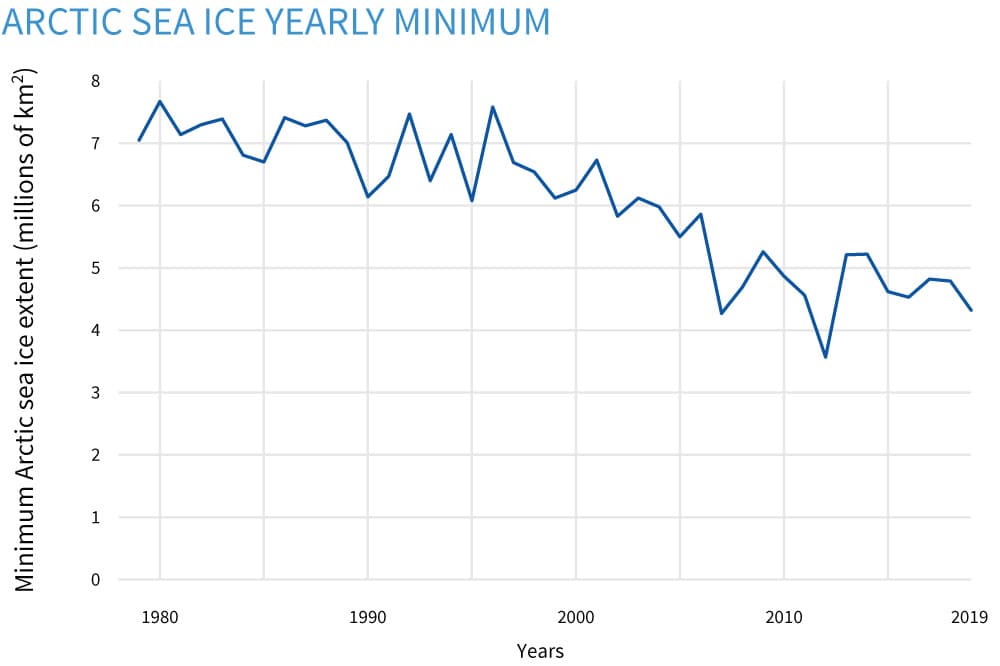
The Arctic continued to warm; minimum sea ice extent was near-record low. The annual mean surface air temperature for the Arctic land areas was the second highest in the 120-year record, trailing only 2016, at 3.1°F (1.7°C) above the 1981–2010 average. In March, when Arctic sea ice reached its annual maximum extent, thin, first-year ice comprised ~77% of all ice, compared to about 55% in the 1980s. Because thinner, younger ice is more vulnerable to melting out in summer, this shift in sea ice age has contributed to the decreasing trend in minimum ice extent.
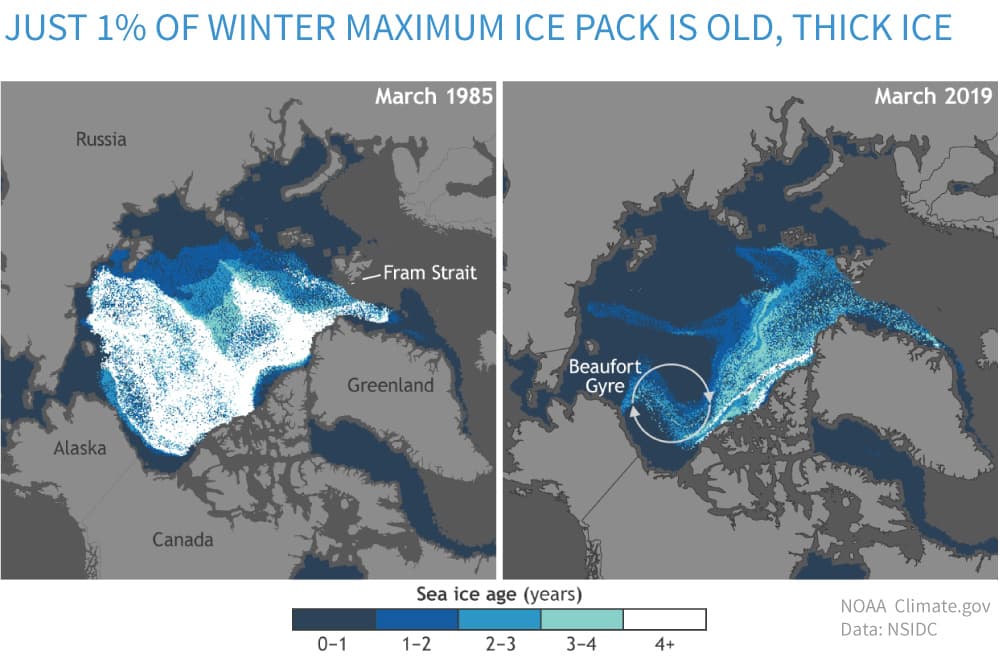
The minimum sea ice extent, reached on September 18, tied with 2007 and 2016 for the second-smallest minimum extent in the 41-year satellite record. Sea ice extent in September across the Arctic Ocean is now declining at a rate of −12.9% per decade. In the Bering Sea, increasing ocean temperatures and reduced sea ice—which was by far the lowest on record there for the second consecutive winter—are leading to shifts in fish distributions within some of the most valuable fisheries in the world.
Antarctica was near-record warm, and its trend in low sea ice extent continued. In the Antarctic, 2019 was the second-warmest year for the continent as a whole since the start of the reanalysis record in 1979, surpassing 2018 (third-warmest year), and behind only 1980. Below-average Antarctic sea ice extent persisted throughout 2019, continuing a trend that began in September 2016.
Net sea ice extent was below the 1981–2010 average for all days of the year, and January and June each set a new low monthly mean sea ice extent record. The Antarctic ice sheet continued to lose mass, with the highest rates of loss occurring in West Antarctica and Wilkes Land, East Antarctica.
Tropical cyclones were well above average overall. There were 96 named tropical storms during the Northern and Southern Hemisphere storm seasons, well above the 1981–2010 average of 82. Five tropical cyclones reached Saffir–Simpson scale Category 5 intensity. In the North Atlantic basin, Hurricane Dorian caused unprecedented and tremendous devastation, with over 200 fatalities and damages totaling $3.4 billion (U.S. dollars) in The Bahamas. Tropical Cyclones Idai and Kenneth severely impacted southeastern Africa in March and April, respectively. Idai resulted in total damages of at least $2.2 billion (U.S. dollars), the costliest storm on record for the South Indian Ocean basin, as well as the deadliest with over 1,200 fatalities across Mozambique, Zimbabwe, Malawi, and Madagascar.
The Indian Ocean dipole impacted weather from Africa to Australia. The Indian Ocean dipole—which is measured as the difference between sea surface temperature departure from averages in the eastern Indian Ocean and the western Indian Ocean—in October, reached its strongest positive phase since 1997, associated with dramatic surface warming in the western Indian Ocean basin.
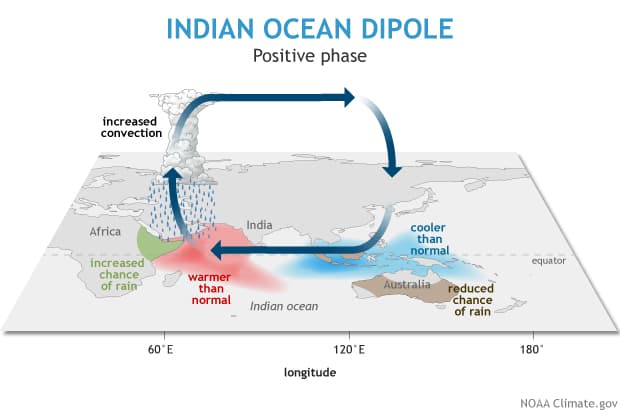
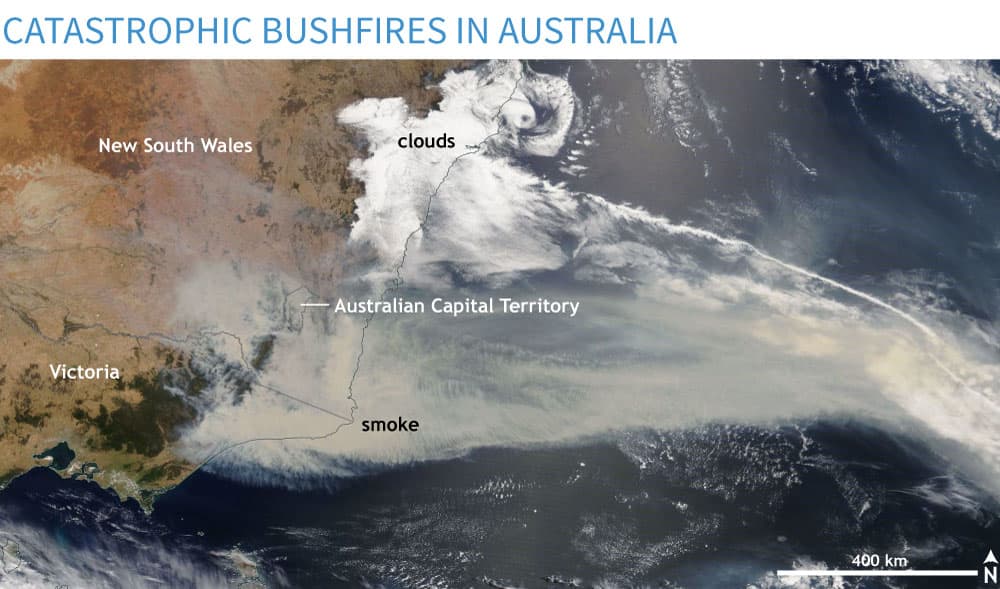
This contributed to excess rainfall over the Horn of Africa from August through December, resulting in widespread flooding across East Africa, while simultaneously contributing to a large rainfall deficit from the eastern Indian Ocean to the South Pacific Ocean east of Australia. Record heat and dryness in Australia intensified drought conditions already in place following below-average rainfall in 2017 and 2018, leading to severe impacts during late austral spring and summer, including catastrophic wildfires.
Geographical Regional Highlights
Additional geographical regional highlights include:
North America
Mexico reported its second warmest year in its 48-year record, and Alaska reported its warmest in its 95-year record.
The contiguous United States observed its second wettest year on record, behind 1973. Canada experienced a catastrophic spring flood along the Ottawa and St. Lawrence Rivers. This was even larger than an event that occurred in 2017, considered at the time to be the flood of the century.
For a third consecutive year, drought conditions worsened in southern Mexico due to the absence of tropical cyclones near this region.
Central America and the Caribbean
The Caribbean region observed its warmest year since records began in 1891.
Tropical Storm Karen caused flooding and storm surges in parts of the southeastern and northeastern Caribbean, impacting Trinidad and Tobago, Dominica, Puerto Rico, and other islands. The storm impacted Puerto Rico the day after the island experienced a 6.0 earthquake on the Richter scale.
South America
South America as a whole observed its second-warmest year on record, behind only 2015. The last five years were the five warmest years in the continental 110-year record.
In south-central Chile, rainfall deficits in 2019 added to a prolonged drought that began there in 2010. The cities of Valparaiso and Curicó (Chile) and Bahía Blanca (Argentina) had their driest year on record since 1961.
Africa
The year 2019 was the warmest year on record for South Africa (tied with 2015) as well as for several western Indian Ocean islands, including Mauritius, Mayotte, Comoros, Seychelles, and Réunion Island.
A strong positive Indian Ocean dipole contributed to excess rainfall in the Horn of Africa from October through December that resulted in widespread flooding across East Africa. Mombasa (Kenya) and Kinshasa and Pt. Noire (Republic of Congo) received more than five times their normal October rainfall.
Europe
The year 2019 was among its four warmest years on record for Europe, with all four of the warmest years occurring since 2014. Record warmth was reported for Estonia (tied with 2015), Serbia, Belarus, Romania, Ukraine, Moldova, Poland, Latvia, Lithuania, and Hungary.
Two major heat waves occurred in June and July across central and western Europe. On July 25, a new German national daily high temperature record of 42.6°C was set at Lingen. New national all-time daily record temperatures were also set in the Netherlands and Belgium, as daily temperatures surpassed 40°C in those countries.
Asia
2019 was the warmest year on record for Japan, Hong Kong, and Singapore (tied with 2016). On April 20, the temperature in Huong Khe (Ha Tinh), Vietnam, reached 43.4°C, a new national high temperature record. On July 17, Tehran, Iran, set a new record high minimum (nighttime) temperature of 33.8°C.
Indonesia was marked by severe drought during the year. In one of the most affected areas, no rain fell in the East Sumba District of the East Nusa Tenggara Province for 263 days.
Five tropical cyclones made landfall in China. Tropical Cyclone Lekima was the fifth-strongest storm to make landfall since 1949 and caused approximately $8.5 billion (U.S. dollars) in direct economic losses. Seven typhoons affected South Korea, tying with 1950 and 1959 for the most on record.
Oceania
The year was record hot in Australia, with warmth persistent through the year. January was Australia’s warmest month among all months in the 110-year record. The country observed its all-time hottest day on December 18, when the national maximum temperature reached 107.38°F (41.88°C), easily exceeding the previous record by 2.84°F (1.58°C).
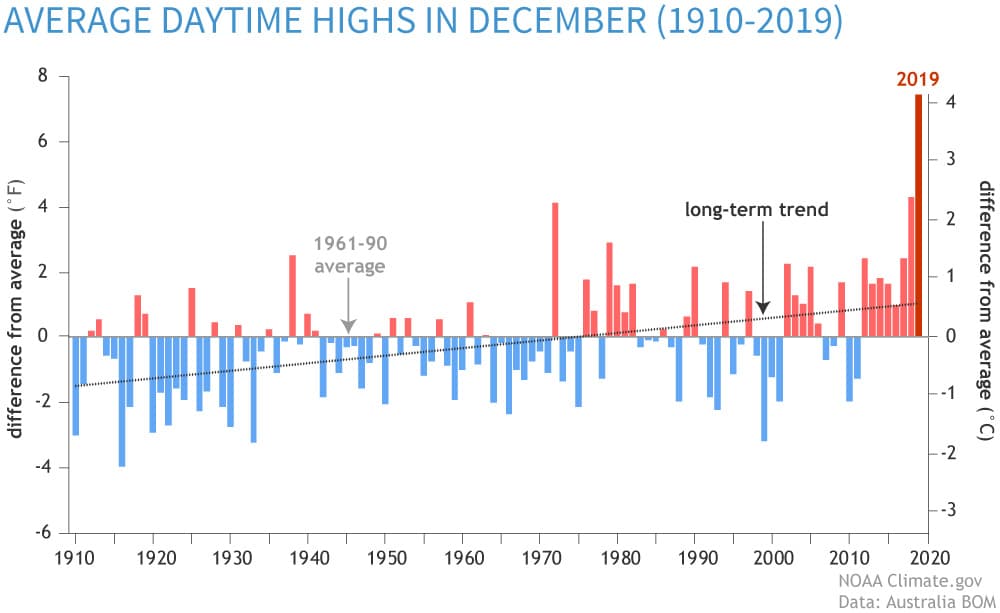
Very large bushfires affected eastern Australia from September into the early days of 2020, burning around 5 million hectares. Smoke from these wildfires was detected across much of the Southern Hemisphere.
In February, Tropical Cyclone Oma brought heavy rain, floods, and strong winds to the northern provinces of Vanuatu and Ile Art, the northern archipelago of New Caledonia. Both areas suffered substantial impacts to their agricultural industries. At the end of December, Tropical Cyclone Sarai impacted the main Fiji Island, Viti Levu, resulting in flooding and extensive damage to infrastructure.
The State of the Climate in 2019 is the 30th edition in a peer-reviewed series published annually as a special supplement to the Bulletin of the American Meteorological Society. The Journal makes the full report openly available online.
Well this sucks