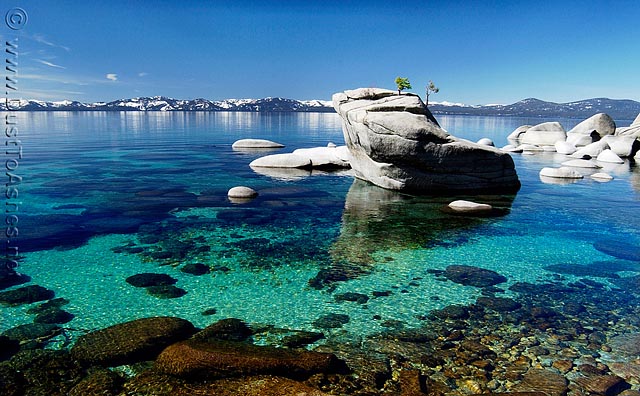
Lake Tahoe water clarity hit it’s best point since 2002 at 77.8-feet of clarity. That’s a 7.5-feet improvement in clarity from last year and a huge improvement of the lowest ever recording of 64.1-feet in 1997. The best clarity measurement for Tahoe was 102.4-feet in 1968.
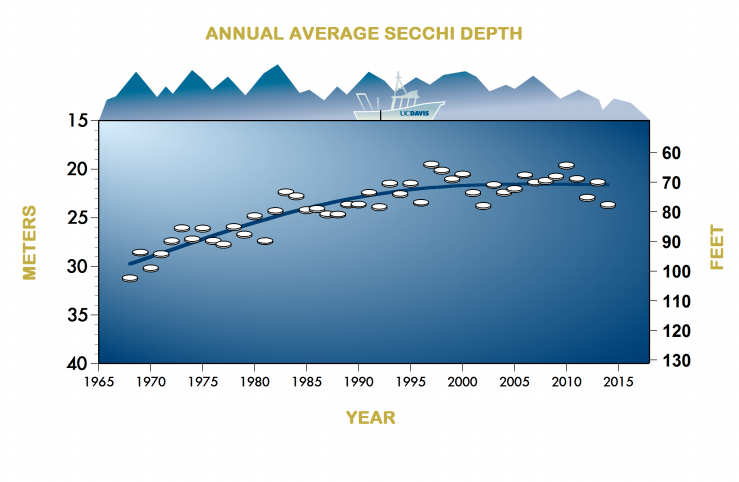
They acquire this measurement by dropping a 10-inch diameter white disk and sinking it until it is no longer visible. The last depth the disk is visible is the depth they use as the clarity measurement. Researchers actually got one reading this past July that was over 93-feet.
UC Davis conducted the study and they’re reporting that the dramatic clarity improvement is likely due to the current historic drought.
UC DAVIS LAKE TAHOE CLARITY PRESS RELEASE:
Clarity levels at Lake Tahoe in 2014 showed the biggest improvements in more than a decade, according to researchers at the University of California, Davis, who have studied the lake for the last half century.
The improvements are in part due to continuous work from the Lake Tahoe community to lower pollutants to the lake. They were also influenced by the drought, as reduced precipitation meant fewer contaminants flowed into Lake Tahoe, particularly during the summer, when clarity levels were the highest recorded since 2002.
Data released today by the UC Davis Tahoe Environmental Research Center and the Tahoe Regional Planning Agency showed that the average annual clarity level for 2014 is at 77.8 feet. That is the depth at which a 10-inch white disk, called a Secchi disk, remains visible when lowered into the water. This represents a 7.5 foot increase over the previous year and is almost 14 feet greater than the value of 64.1 feet in 1997, when the lowest average clarity value was recorded.
“While these latest data are very reassuring, they should not be interpreted as victory in our joint restoration efforts,” said Geoffrey Schladow, director of the UC Davis Tahoe Environmental Research Center. “Complete restoration is still decades away, and some of the greatest challenges still lie ahead of us. We are enduring drier and warmer conditions than we have ever encountered, and the restoration consequences of that are still far from understood.”
Warm, dry summer: clearly complex
The clarity level this year is the average of 28 individual readings taken throughout the year. The highest individual value recorded in 2014 was 93.5 feet on July 7, and the lowest was 57.4 feet on Sept. 16.
Researchers provided measurements for both winter (December-March) and summer (June-September) months. Winter clarity last year improved by 1 foot, continuing the long-term pattern of improvement since 1997. The winter average of 78.7 feet was well above the worst winter average, 66.6 feet, seen in 1997.
The largest improvement was seen in summer clarity, where there was a 13-foot improvement over the preceding year. At 78.7 feet this is the highest value since 2002.
The long-term trend in summer clarity is very complex, and is the result of many factors, including the amount of precipitation in the basin and the depth to which the lake mixed the previous winter.
In 2014, the ongoing drought produced very small inflows, which transported fewer contaminants into Lake Tahoe. The warmer conditions also resulted in very shallow mixing. Years of shallow mixing are often years of high clarity.
Working together
The Tahoe Regional Planning Agency leads the collaborative effort to reduce stormwater runoff and manages the multijurisdictional Lake Tahoe Environmental Improvement Program to repair past damage to the ecosystem.
Over the past two decades, the Environmental Improvement Program has resulted in substantial public and private investment in projects to improve water quality and other environmental indicators at Lake Tahoe. Among the hundreds of measurements the TRPA tracks, mid-lake clarity is a key indicator of whether restoration programs are working.
“Despite the impact of reduced runoff from the drought in 2014, these findings underscore that our collaborative efforts to reduce erosion and stormwater pollution in the Lake Tahoe Basin are working and have halted the decline in mid-lake water clarity,” said Joanne S. Marchetta, executive director of the Tahoe Regional Planning Agency. “Still troubling, however, is the fact that Lake Tahoe’s nearshore waters are experiencing problems with reduced clarity, algae growth, and invasive species. We must remain vigilant in our pursuit of the lake’s restoration.”
Clarity a key indicator for Tahoe
Water clarity measurements have been taken continuously since 1968, when the Secchi disk could be seen down to 102.4 feet, and is one of the longest, unbroken clarity records in the world. Secchi depth is the most widely used method of clarity measurement, and the values are in agreement with the laser-based measurements that are also taken by TERC researchers.
Improved real-time monitoring instruments, together with sophisticated models of the lake currents that transport contaminants in Lake Tahoe, are helping researchers build a deeper understanding of restoration progress within the entire lake ecosystem.
“Many of the long-held assumptions about lake clarity and conditions in the nearshore areas of the lake are finally being tested,” Schladow said.
While the average annual clarity in the past decade has been better than in preceding decades, it is still short of the clarity restoration target of 97.4 feet set by federal and state regulators.
Annual average clarity readings since 1997
- 2014: 77.8 feet
- 2013: 70.2 feet
- 2012: 75.3 feet
- 2011: 68.9 feet
- 2010: 64.4 feet
- 2009: 68.1 feet
- 2008: 69.6 feet
- 2007: 70.1 feet
- 2006: 67.7 feet
- 2005: 72.4 feet
- 2004: 73.6 feet
- 2003: 71.0 feet
- 2002: 78.0 feet
- 2001: 73.6 feet
- 2000: 67.3 feet
- 1999: 69.0 feet
- 1998: 66.1 feet
- 1997: 64.1 feet
More information about environmental factors affecting Lake Tahoe will be included in the 2015 State of the Lake Report, expected this summer.
Funding for TERC’s clarity analyses comes from the Tahoe Regional Planning Agency and from UC Davis.