Whistler just released its quarterly report on Wednesday, February 10th, 2016. Whistler Blackcomb Holdings Inc. reported 1.14 million skier visits as of Feb. 8th, 2016, which is the highest year-to-date skier visits in the company’s history and a 21% increase over this time period last season.
“We are very pleased with our first quarter performance. Increased guest visitation from both our regional and destination markets combined with strong spending in our ancillary businesses contributed to our record financial results.”
“Since December 31, 2015, our strong visitation momentum has continued and I am pleased to report that we have welcomed the highest total visits in our history for the year to date period.” — Whistler Blackcomb president Dave Brownlie in a release
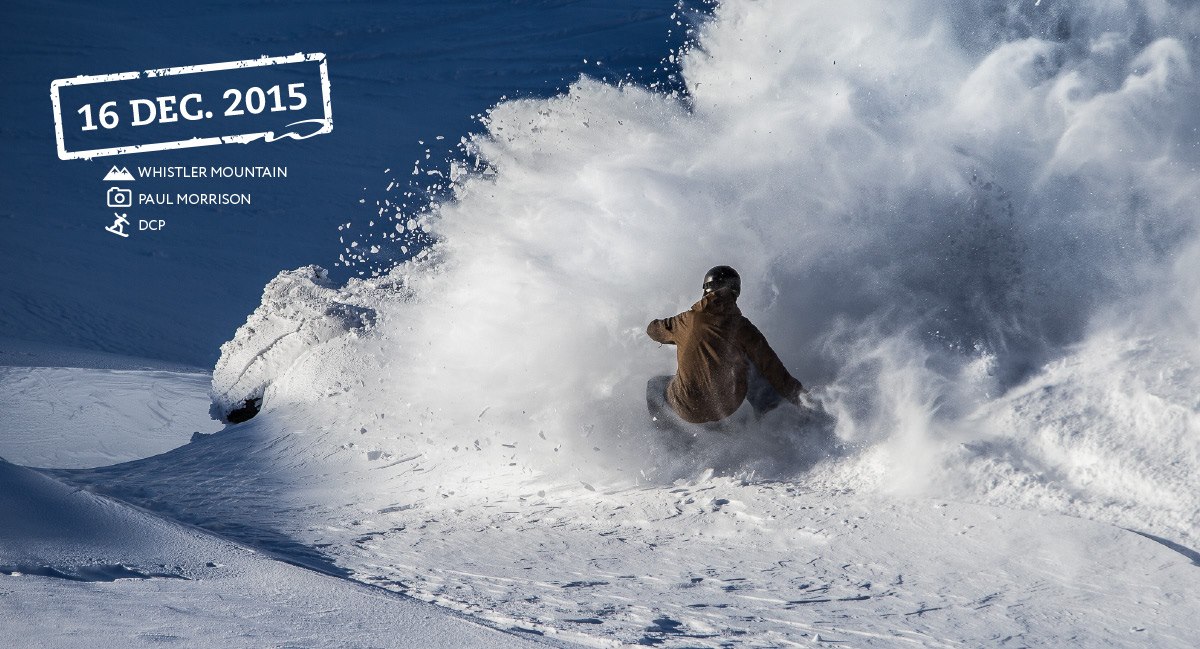
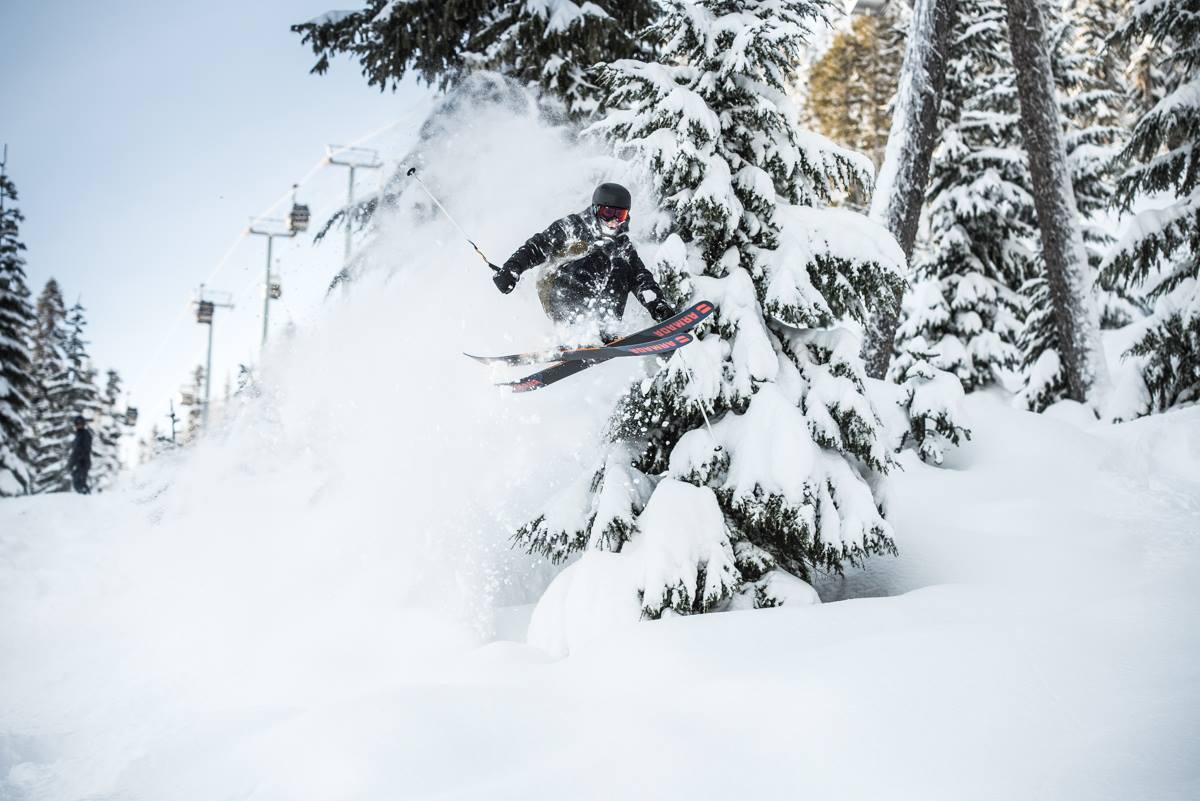
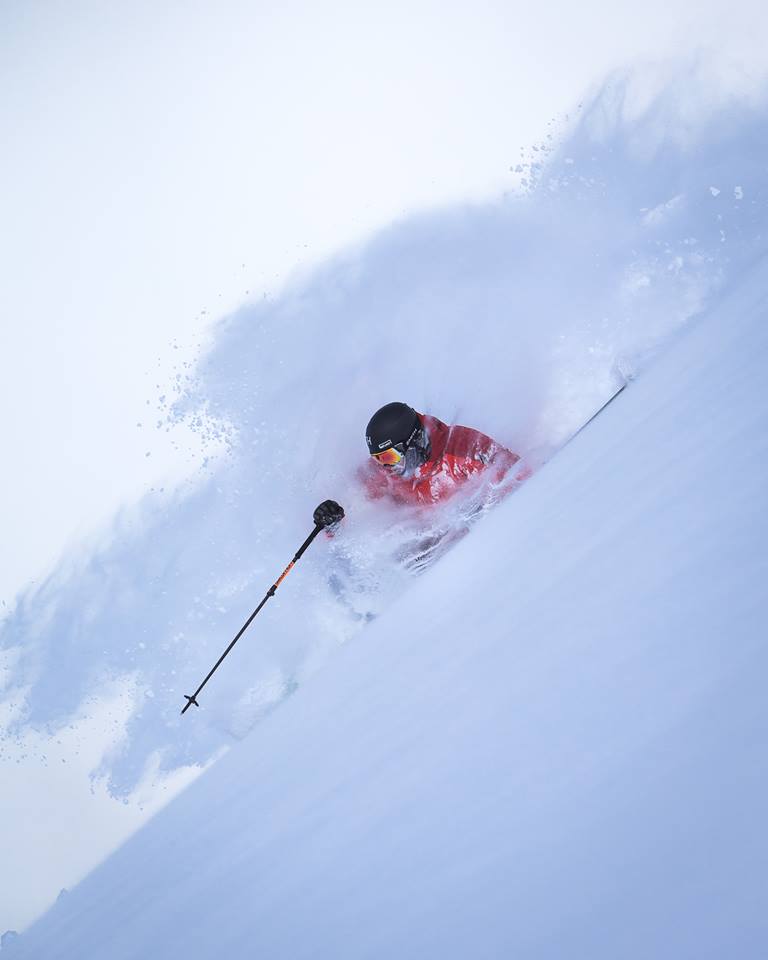
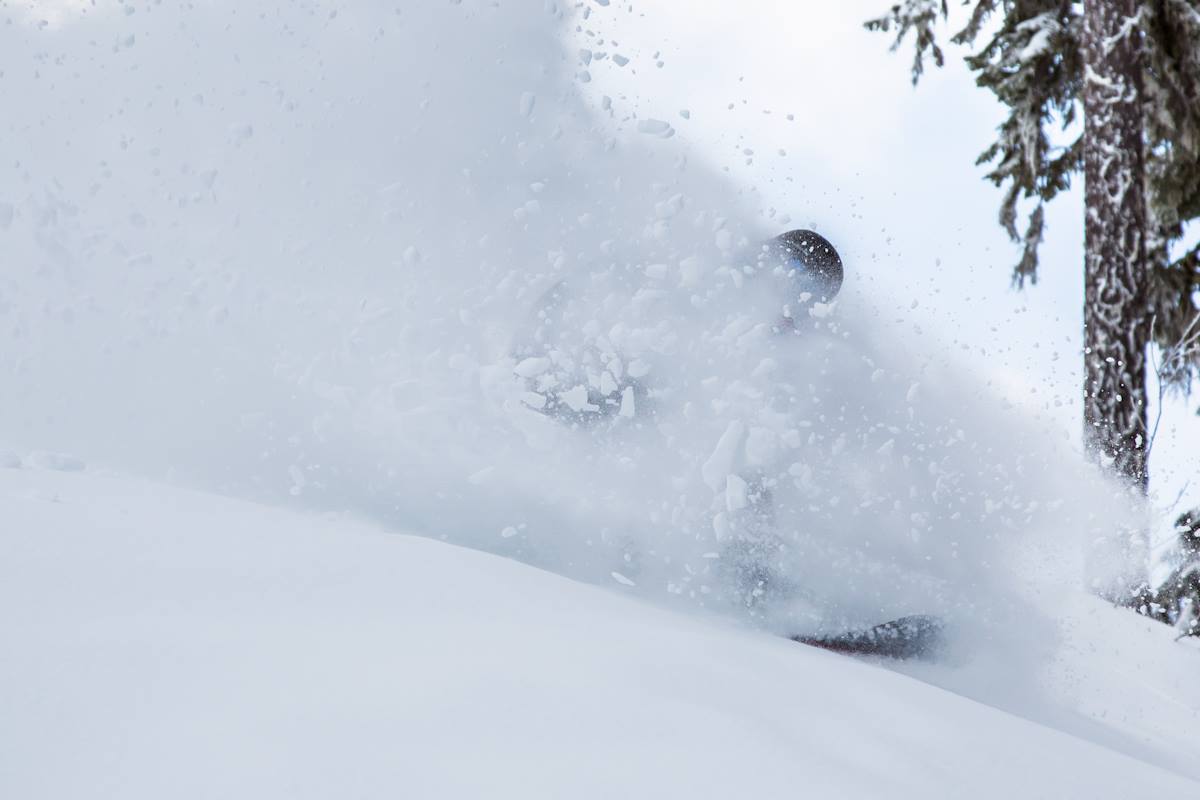
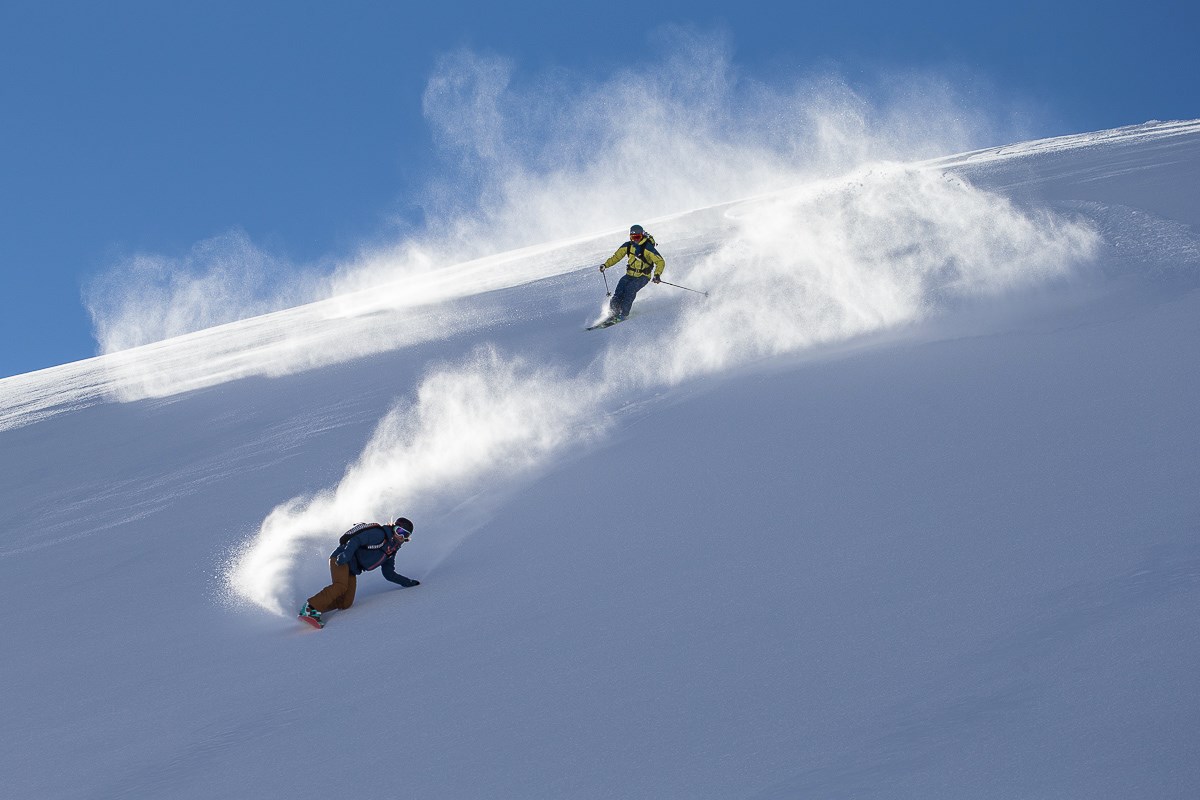
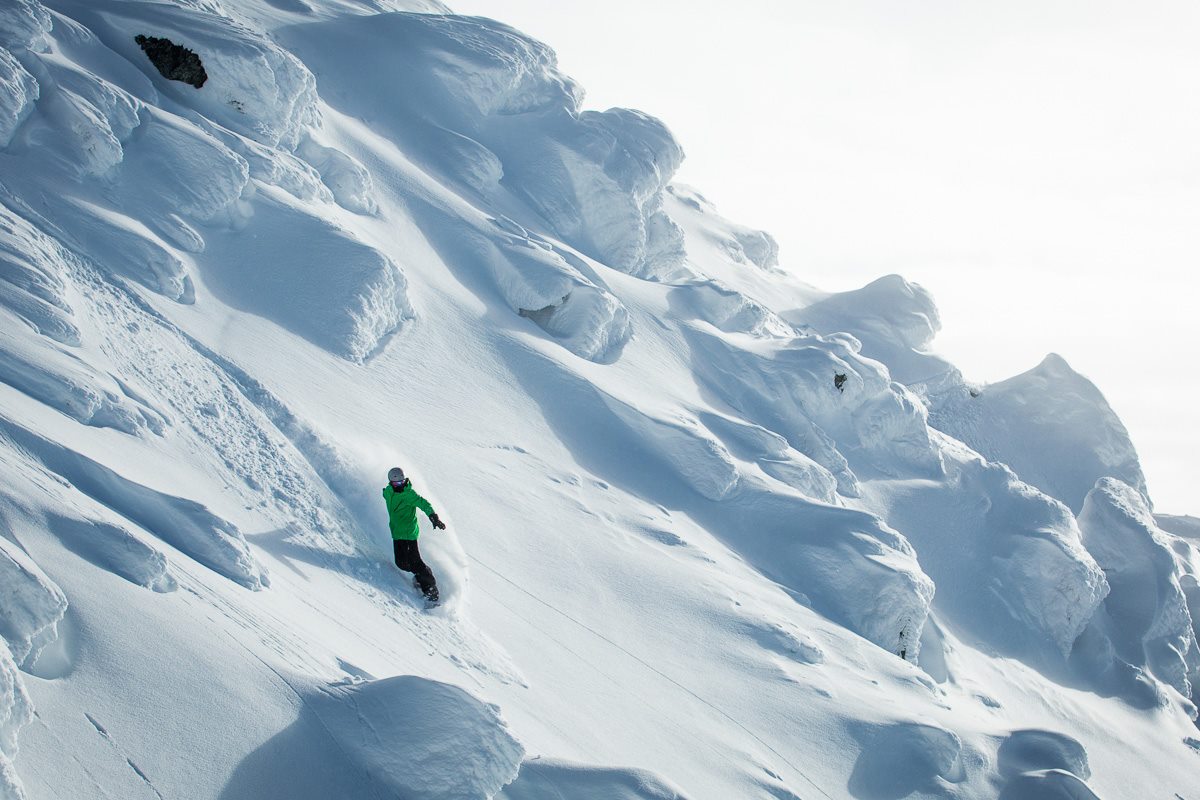
Big early season snowfall in Whistler this year is at least partly to blame. Conditions were all-time this November & December and the snow just keeps piling up.
Whister has seen 300″ of snowfall this winter. Whistler had 104″ of snowfall as of December 1st – 2015, 163″ as of December 18th, 2015 – and 245″ as of January 22nd, 2016.
Whistler Blackcomb Numbers:
- 502,000 skier visits in November and December 2015 – up 23.3% from the same time period last season.
- $66.7 million in revenue in the first quarter this year – up 22.1% from the same time period last season.
- Skier visits so far = 58% regional visitors & 42% destination visitors.
Whistler also announced that they will be putting in $8 million in capital investment including:
- Upgrades to and expansion of the Garibaldi Lift Company and the Roundhouse Lodge on Whistler Mountain.
- Upgrades and enhancements to ski and snowboard learning terrain and infrastructure on Whistler Mountain.
- The addition of summer hiking trails and infrastructure to go along with the construction of a new glacier-view sightseeing deck connected to the Roundhouse Lodge.
“These projects ighlight our continued focus on our long-term strategy of upgrading and expanding our on-mountain facilities and infrastructure, expanding our non-ski business and executing on other strategic investments.”- – Whistler Blackcomb president Dave Brownlie in a release
FULL WHISTLER QUARTERLY REPORT – FEB. 10TH, 2016:
| February 10, 2016 – 7:00 AM EST |
|


Whistler Blackcomb Holdings Inc. Announces Record First Quarter Results and Strong Mid-season Indicators
WHISTLER, BC, Feb. 10, 2016 /PRNewswire/ – Whistler Blackcomb Holdings Inc. (TSX: WB) (the “Company”) today reported record financial results for the first quarter ended December 31, 2015 and announced strong mid-season indicators as of February 8, 2016. The Company holds a 75% interest in and manages the entities that operate Whistler Blackcomb, the largest four-season mountain resort in North America. Highlights
Dave Brownlie, President and Chief Executive Officer of the Company commented: “We are very pleased with our first quarter performance. Increased guest visitation from both our regional and destination markets combined with strong spending in our ancillary businesses contributed to our record financial results. Since December 31, 2015, our strong visitation momentum has continued and I am pleased to report that we have welcomed the highest total visits in our history for the year to date period.” Mr. Brownlie continued: “Looking ahead, we are positioned well for the remainder of the ski season as both season pass and frequency card sales and hotel room bookings are pacing ahead of the same time last year.” Regarding the planned $8 million in growth projects, Mr. Brownlie commented: “The growth projects that we have announced today highlight our continued focus on our long-term strategy of upgrading and expanding our on-mountain facilities and infrastructure, expanding our non-ski business and executing on other strategic investments.” Financial & Operating Results Overview
Visit, Pricing and Financial Results Summary
Treasury Summary
Mid-Season Indicators
Capital Investments The Company also announced plans to invest approximately $8.0 million in the following growth projects, in addition to the Company’s regular maintenance capital program:
All of these investments are designed to grow EBITDA, improve guest experience and enhance the weather resiliency of the Company’s business. The Company expects that these projects will be completed by the start of the 2016-17 ski season. Dividend The Company’s Board of Directors declared a dividend of $0.24375 per common share for the first quarter, to be paid on February 29, 2016 to shareholders of record on February 22, 2016. This dividend will be an eligible dividend for Canadian income tax purposes. Non-GAAP Measures This press release makes reference to Adjusted EBITDA and ETP, which are measures not prescribed by Canadian generally accepted accounting principles, or GAAP. These non-GAAP measures do not have standardized meanings and are therefore unlikely to be comparable to similar measures presented by other companies. Adjusted EBITDA is defined as consolidated net earnings (including net earnings attributable to the 25% non-controlling interest) before interest, taxes, depreciation and amortization, as well as items that management does not consider part of the Company’s normal operations, examples of which include significant non-cash gains or losses on disposal of property, buildings and equipment, acquisition or disposal expenses and gains or losses or restructuring expenses relating to acquisitions or disposals of businesses, impairment, restructuring or refinancing charges and reversals and other significant event-driven amounts as applicable. Adjusted EBITDA is provided as additional information to complement GAAP measures and to further understand the Company’s results of operations from management’s perspective. It is also a supplemental measure of performance that highlights trends in the Company’s business that may not otherwise be apparent when relying solely on GAAP financial measures. Seventy-five percent of Adjusted EBITDA is attributable to WBHI shareholders, based on the Company’s equity interest in the Partnerships. The closest GAAP measure is net earnings and a reconciliation is provided below. ETP is defined as the Company’s ski ticket yield-per-skier visit calculated as total ski-related lift revenue divided by total skier visits. Ski-related lift revenue and skier visits exclude revenue and visits from summer glacier skiing and other revenue amounts. The Company believes ETP is an important measure of operating performance because it allows management, investors and others to evaluate and compare the yield generated by ski lift tickets from period to period, and ski tickets are the Company’s largest source of revenue and the core of its operations. The closest GAAP measure is revenue and a reconciliation is provided below. Non-GAAP measures should not be considered in isolation or as a substitute for analysis of financial information reported in accordance with GAAP. Readers should refer to the Company’s annual information form dated December 11, 2015 and its most recent Management’s Discussion & Analysis, which are available on the Company’s website and under the Company’s SEDAR profile at www.sedar.com, for additional details regarding non-GAAP measures. Reconciliation of Net Earnings (Loss) to Adjusted EBITDA The following table reconciles Adjusted EBITDA to the Company’s most directly comparable GAAP measure, net earnings (loss):
The following table reconciles ETP to our most directly comparable GAAP measure, revenue:
Conference Call Information Management will conduct a conference call on February 10, 2016 at 7:30 a.m. Pacific Time / 10:30 a.m. Eastern Time to review the Company’s fiscal 2016 first quarter results. The call can be accessed by dialing 1.800.319.4610 (Canada and US) or 1.604.638.5340 (International) prior to the start of the call. A live webcast and 30 day replay of the conference call will be available in the Presentation & Webcasts section of the Company’s website. ABOUT WHISTLER BLACKCOMB HOLDINGS INC. The Company holds a 75% interest in each of Whistler Mountain Resort Limited Partnership and Blackcomb Skiing Enterprises Limited Partnership (the “Partnerships”), which, together, carry on the four season mountain resort business located in the Resort Municipality of Whistler, British Columbia (the “Resort Business”). The Company is the operating general partner of the Partnerships and as such manages the Resort Business. Whistler Blackcomb, the official alpine skiing venue for the 2010 Olympic Winter Games, is situated in the Coast Mountains of British Columbia, 125 kilometres (78 miles) north of Vancouver, British Columbia. North America’s largest four-season mountain resort, Whistler Mountain and Blackcomb Mountain are two side-by-side mountains, connected by the world record-breaking PEAK 2 PEAK Gondola, which combined offer over 200 marked runs, over 8,000 acres of terrain, 14 alpine bowls, three glaciers, receive on average over 1,163 centimetres (458 inches) of snow annually, and offer one of the longest ski seasons in North America. In the summer, Whistler Blackcomb offers a variety of activities, including hiking and biking trails, the Whistler Mountain Bike Park, and sightseeing on the PEAK 2 PEAK Gondola. Whistler Blackcomb Holdings Inc. is listed on the Toronto Stock Exchange under the symbol “WB”. Additional information is available on the Company’s website atwww.whistlerblackcomb.com/holdings or under the Company’s SEDAR profile at www.sedar.com. CAUTIONARY NOTE REGARDING FORWARD-LOOKING STATEMENTS This press release and the associated conference call and webcast, which include a business update, first quarter results and a question and answer session, may contain certain forward-looking statements or information, within the meaning of applicable Canadian securities laws, which reflect the current view of the Company with respect to future events and financial performance. Forward-looking statements can often be identified by the use of forward-looking terminology such as “may”, “will”, “would”, “could”, “should”, “expect”, “intend”, “estimate”, “anticipate”, “plan”, “foresee”, “believe” or “continue” or the negatives of such terms or variations of them or similar terminology. All forward-looking statements made by the Company are based on the opinions and estimates of management as of the date such statements are made and represent management’s best judgment based on facts and assumptions that management considers reasonable. The forward-looking statements and information contained in this press release and the associated conference call and webcast are based on certain factors and assumptions made by management of the Company including, but not limited to: business conditions, guest visitation, the Company benefiting from capital investments, visit momentum and encouraging 2015-16 season pass and frequency card sales and accommodation bookings, weather, macroeconomic and currency influences, and interest rates, among others. These forward-looking statements and information are subject to a number of risks and uncertainties that could cause actual results to differ materially from those anticipated including, but not limited to, unfavourable weather conditions, unfavorable economic conditions, decreases in leisure and business travel, seasonality of operations, capital expenditures, currency fluctuations, reliance on agreements with the Province of British Columbia to operate the Resort Business, competition from other resorts, dependence on key employees and seasonal workforce, workforce risks, the impact of natural disasters, risks related to the credit facility and interest rate risks, adequacy of insurance coverage, litigation or governmental investigations, safety and accident risks, environmental laws and regulations, risks related to privacy laws, information technology and the processing of credit card information, negative publicity or unauthorized use of the Company’s trademarks or trade names, risks relating to growth projects and acquisitions, risks relating to third party interests and risks relating to an investment in the common shares of the Company, including with regard to dividend payments and future sales or issuances of common shares of the Company. A more detailed description of these risks is available in the Company’s most recently filed annual information form and management’s discussion and analysis, which is available on the Company’s website and at www.sedar.com under the Company’s SEDAR profile. Should one or more of these risks or uncertainties materialize, or should assumptions underlying the forward-looking statements or information prove incorrect, actual results may vary materially from those described herein. Although the Company believes that the expectations reflected in such forward-looking statements and information are reasonable, undue reliance should not be placed on forward-looking statements or information because the Company can give no assurance that such expectations will prove to be correct. These forward-looking statements and information are made as of the date of this press release, and the Company has no intention and assumes no obligation to update or revise any forward-looking statements or information to reflect new events or circumstances, except as required by applicable Canadian securities laws. Whistler Blackcomb Holdings Inc.
Whistler Blackcomb Holdings Inc.
Whistler Blackcomb Holdings Inc.
SOURCE Whistler Blackcomb
Source: PR Newswire (February 10, 2016 – 7:00 AM EST) News by QuoteMedia |
|||||||||||||||||||||||||||||||||||||||||||||||||||||||||||||||||||||||||||||||||||||||||||||||||||||||||||||||||||||||||||||||||||||||||||||||||||||||||||||||||||||||||||||||||||||||||||||||||||||||||||||||||||||||||||||||||||||||||||||||||||||||||||||||||||||||||||||||||||||||||||||||||||||||||||||||||||||||||||||||||||||||||||||||||||||||||||||||||||||||||||||||||||||||||||||||||||||||||||||||||||||||||||||||||||||||||||||||||||||||||||||||||||||||||||||||||||||||||||||||||||||||||||||||||||||||||||||||||||||||||||||||||||||||||||||||||||||||||||||||||||||||||||||||||||||||||||||||||||||||||||||||||||||||||||||||||||||||||||||||||||||||||||||||||||||||||||||||||||||||||||||||||||||||||||||||||||||||||||||||||||||||||||||||||||||||||||||||||||||||||||||||||||||||||||||||||||||||||||||||||||||||||||||||||||||||||||||||||||||||||||||||||||||||||||||||||||||||||||||||||||||||||||||||||||||||||||||||||||||||||||||||||||||||||||||||||||||||||||||||||||


If only I could verify all the financials…?