For more than a decade, drought has plagued central Chile. The prolonged dry period—a megadrought—has fueled wildfires, strained water supplies, and parched crops.
In winter 2023, the region got some relief in the form of two atmospheric rivers that brought hundreds of millimeters of rain and snow to the region. However, too much rain fell too quickly in some areas, prompting floods and mudslides that damaged roads and bridges, destroyed thousands of homes, and displaced tens of thousands of people.
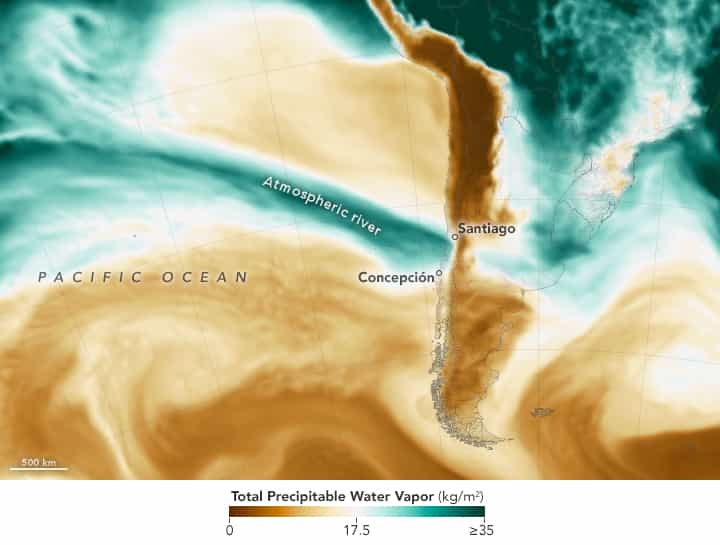
The map above shows the total precipitable water vapor in the atmosphere on August 21, 2023. Precipitable water vapor is the amount of water in a column of the atmosphere if all of the water vapor were condensed into liquid. The image was derived from the Goddard Earth Observing System (GEOS), which uses satellite data and models of physical processes to calculate what is happening in Earth’s atmosphere, oceans, and land surfaces.
The narrow band of moisture (green) stretching from the central Pacific Ocean to Chile is a signature of an atmospheric river—a long, narrow region that transports vast amounts of water vapor from the tropics poleward. In subtropical Chile, atmospheric rivers contribute 45 to 60 percent of the annual precipitation, most of it in the winter rainy season (June to September).
El Paico in the Santiago metropolitan region saw nearly 80 millimeters (3 inches) of rainfall between August 19-21, while areas farther inland in the foothills of the Andes saw as much as 370 millimeters (15 inches) of rain, according to Floodlist. Meanwhile, some news outlets reported that 2 or more meters (up to 8 feet) of snow fell in high mountain areas.

Some of the worst flooding occurred in the Maule, Ñuble, and Biobío regions of Chile. “There was a strong orographic effect,” said atmospheric scientist René Garreaud of Universidad de Chile. “We saw five to ten times more rain in the Andean foothills compared to Chile’s Central Valley.”
Higher elevation areas saw boosted rainfall totals because the Andes forced the incoming river of moisture upward, where lower air pressure and cooler temperatures cause water vapor to condense more easily into rain droplets on the windward side of mountains. This same effect produces rain shadows on the lee side of mountains.
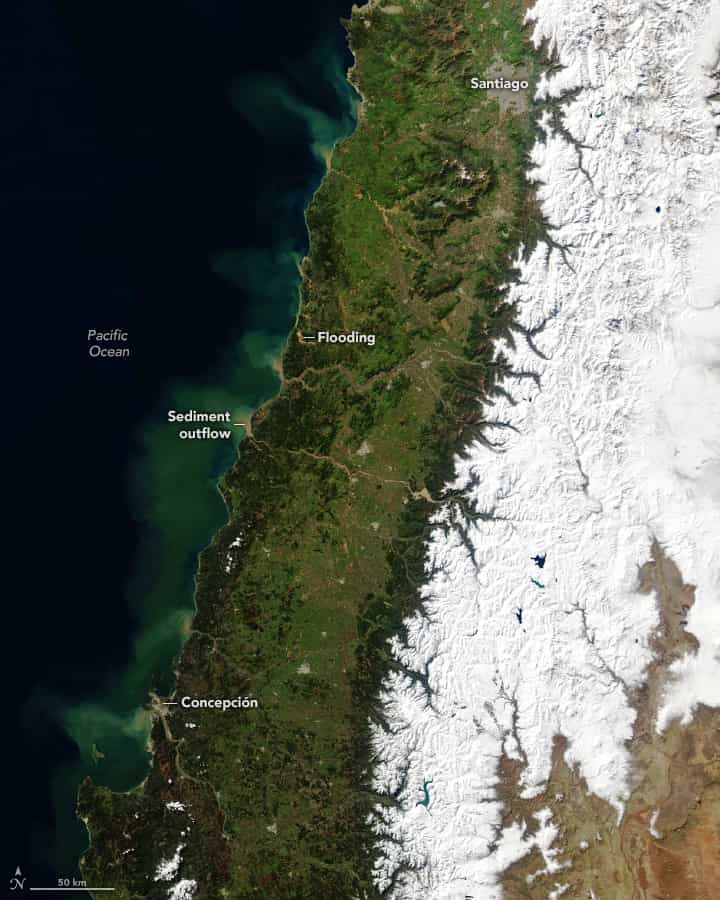
Several days after the surge of rain, rivers were still swollen and discolored. Floodwaters can pick up material, such as sediment from riverbanks, that becomes suspended in the water and makes it appear brown. The Moderate Resolution Imaging Spectroradiometer(MODIS) on NASA’s Aqua satellite captured an image (above) showing rivers carrying plumes of suspended sediment into the Pacific Ocean on August 26, 2023.
The atmospheric river in August followed a similar event in June. According to Garreaud, the June event delivered more than 500 millimeters (20 inches) of rain over a two-day period to the Maule foothills, roughly double what normally falls in Santiago in a year.
The El Niño developing in the Pacific may be affecting how these events play out. “We are seeing extra moisture in the central Pacific, but the coupling with the atmosphere is still relatively weak,” Garreuad said. “The Pacific anticyclone remains strong, and we haven’t yet seen a blocking high to the south of the continent—the typical signature of winter storms that are strongly influenced by El Niño.”
The concept of atmospheric rivers first emerged in the 1990s and has become a topic of growing interest to researchers in recent years. Some research suggests that climate change may be causing atmospheric rivers to produce more rain and shift poleward. One analysis of model projections conducted by a team of scientists at NASA’s Jet Propulsion Laboratory found that atmospheric rivers may decrease in frequency but grow longer and wider under a scenario in which future greenhouse gas emissions remain high.
This post first appeared on NASA Earth Observatory. NASA Earth Observatory images by Lauren Dauphin and Wanmei Liang, using GEOS-FPdata from the Global Modeling and Assimilation Office at NASA GSFC and MODIS data from NASA EOSDIS LANCE and GIBS/Worldview. Story by Adam Voiland.