This article originally appeared on the Utah Avalanche Center website

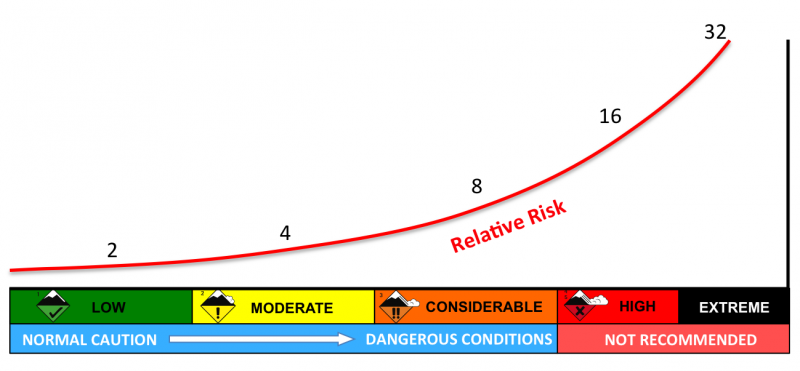
- The scale is not linear. Your risk increases about twofold for each rising level on the danger scale. In other words, you take on twice as much risk at Moderate as Low and you take on four times more risk going from Low to Considerable. And so on. The risk numbers in the graph below come from Werner Munter’s estimates based on avalanche activity in Switzerland.
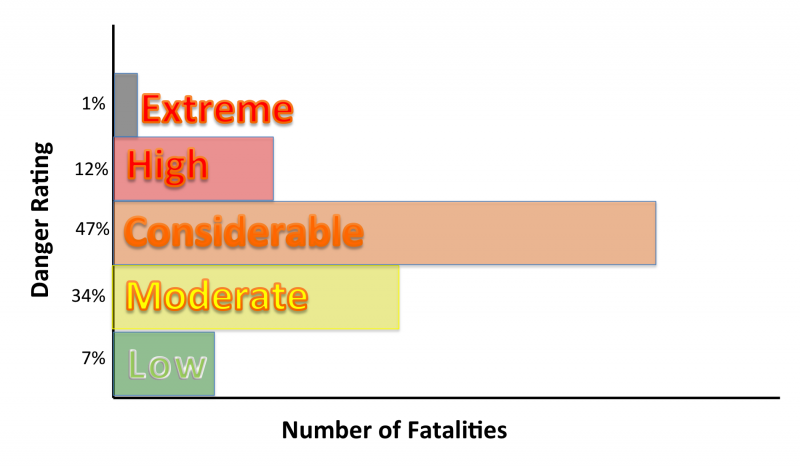
- Most avalanche fatalities occur at Considerable danger because the maximum interaction between people and avalanches occurs there. There is also more uncertainty associated with Considerable danger and the difference between dangerous and not-so-dangerous terrain is much harder to identify.
Most people go into avalanche terrain in the middle danger ratings. Thus, avalanche fatalities tend to occur when there is a maximum interaction between avalanches and people. - The avalanche danger ratings are for “avalanche terrain” meaning for slopes steep enough to slide, in other words, slopes generally steeper than 30 degrees. But since 3 out of 4 avalanches occur on slopes between 34 and 45 degrees, the danger ratings are mainly for these slope angles. Even on High Danger days, you can always find safe terrain on low angled slopes not locally connected to steeper slopes.
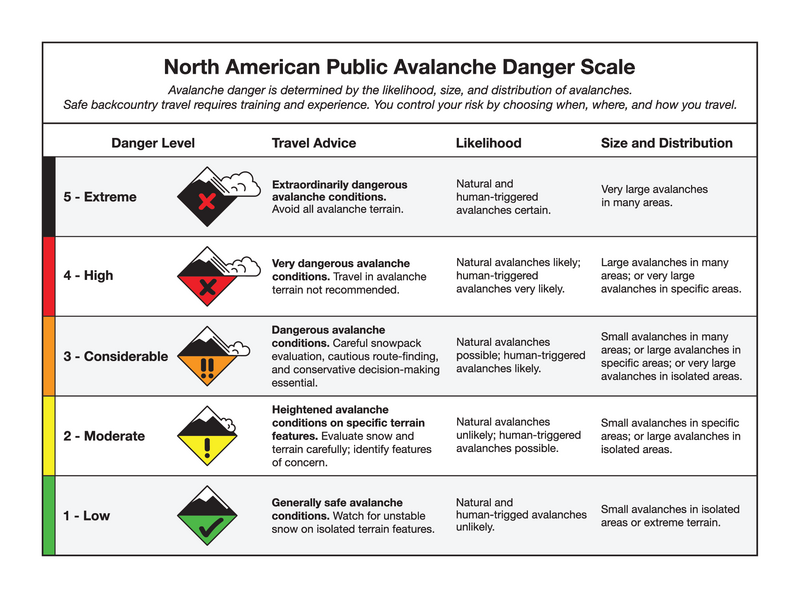
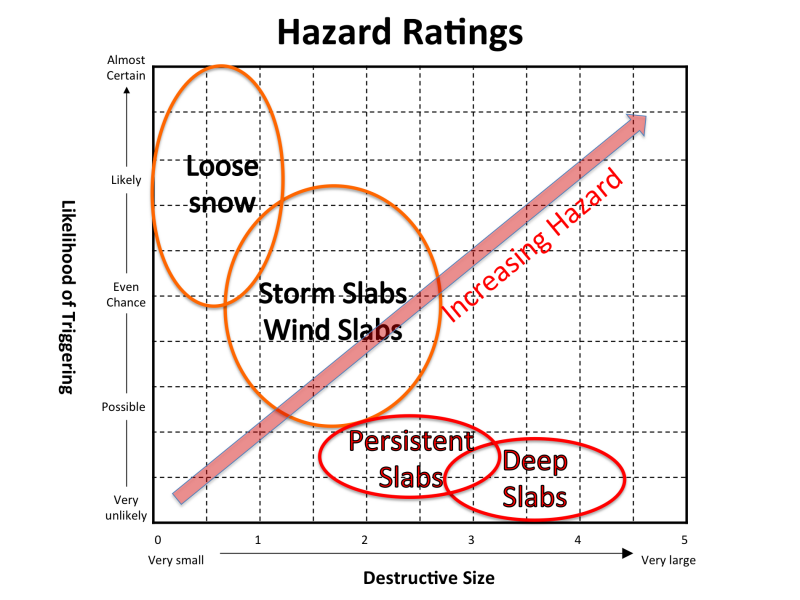
- The danger ratings are based on BOTH probability and consequences. In times past, the danger ratings were based on just probability of triggering an avalanche but with the new danger ratings that came out in 2010, they are based on Likelihood of Triggering (probability) versus Size (consequences). This was adopted to conform to standard risk theory and also as a better way to communicate the character of the hazard, for instance avalanches that are hard to trigger but if you do trigger one, it will be very large and dangerous.
Since avalanche danger depends on BOTH probability and consequences, different avalanche problems with the same danger rating can have very different characteristics. Some are high probability – low consequences. Some are low probability – high consequence. Some are in the middle. The avalanche problems listed here are typical of where we see them on a probability – consequence plot.


