El Niño’s term is over, and La Niña is favored for the school year (79% chance for November–January). Our neutral summer break is underway, so let’s pack our bags and hit the road.
Summer school
A quick primer for our newer visitors: El Niño and La Niña are opposite phases of the El Niño/Southern Oscillation (ENSO), a climate pattern that changes global atmospheric circulation. El Niño’s signature is warmer-than-average surface water in the eastern and central tropical Pacific, while La Niña is cooler than average. Since they can be predicted many months in advance and change global climate patterns in known ways, we can get an idea of potential upcoming temperatures, rain, drought, and other climate patterns. Neutral conditions occur when the temperature of the tropical Pacific is near average. ENSO-neutral doesn’t have a distinct impact on global climate conditions like El Niño and La Niña do, but there’s always plenty to keep us busy here at the ENSO Blog!
Go to the beach
Let’s see how the tropical Pacific has chosen to spend its downtime. The sea surface temperature in the Niño-3.4 region in June was just 0.16 °C (0.3 °F) above the long-term average, according to the ERSSTv5 dataset. Niño-3.4 is our primary monitoring region for all things ENSO. “Long-term” is defined as the average over 1991–2020, and ERSSTv5 is our most reliable sea surface temperature dataset. +0.16 °C above average is well within the ENSO-neutral range between -0.5 and +0.5 °C.
ENSO is a coupled system, meaning the atmosphere and ocean in the tropical Pacific exhibit characteristic changes and affect each other—check out Michelle’s post for details on how the ocean-atmosphere coupling works. The tropical atmosphere also looks pretty neutral, with overall near-average cloudiness, rain, and near-surface winds.
Math camp
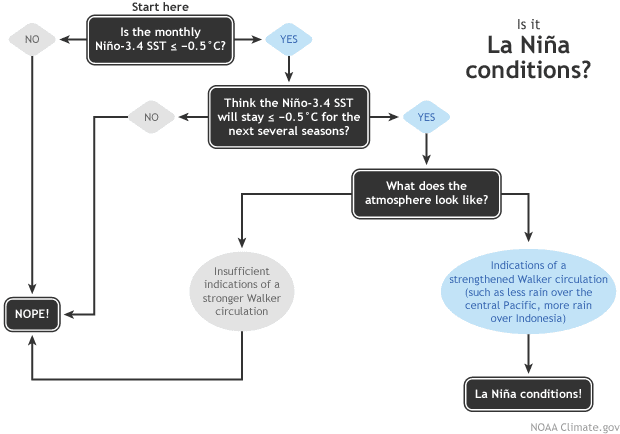
There’s a 70% chance that La Niña will develop during August–October, meaning a one-month Niño-3.4 index at least 0.5 °C (0.9 °F) cooler than average, an expectation it will remain there for several seasons, and atmospheric indications of a stronger-than-average Walker circulation, including more rain than average over Indonesia, drier conditions over the central tropical Pacific (near the International Date Line), and stronger trade winds.
The forecast is based on information from our computer climate models, including the North American Multi-Model Ensemble, a collection of state-of-the-art models (more info here and here). The model forecasts agree that La Niña is likely, although, over the past few months, they have backed off somewhat on the strength of the upcoming event. Currently, the probability that La Niña will peak in our unofficial “moderate” category (3-month-average Niño-3.4 Index at least 1.0 °C cooler than average) is around 50%. The stronger the event, the more likely its expected impacts will occur globally.
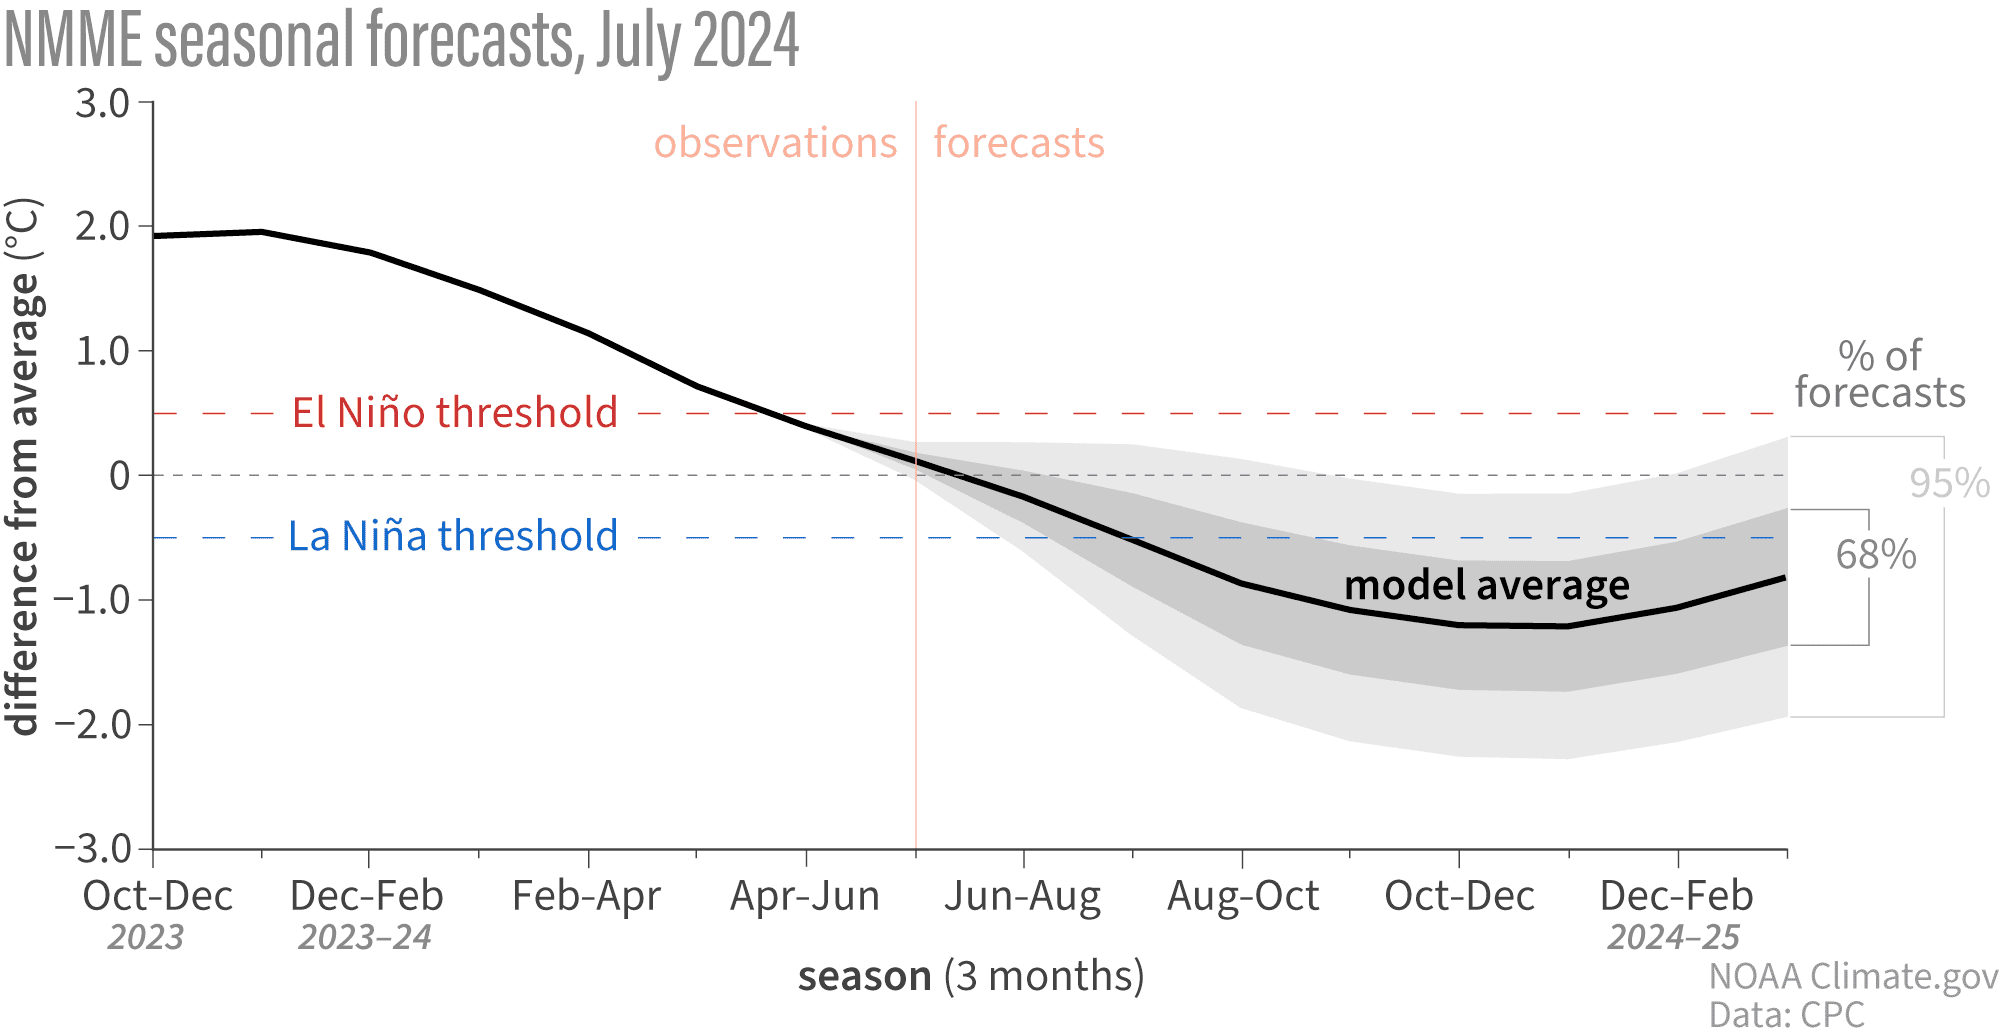
It’s not unusual for the strength predictions to change month to month, especially as we get past the spring predictability barrier when models have a harder time making successful forecasts. We’ll have a clearer picture of the strength in the upcoming months.
Also, remember there’s about a 1-in-5 chance that La Niña won’t show up, and neutral conditions will last through the winter. So, while we don’t think this is a likely outcome, it’s far from impossible. If neutral lingers through the winter, we won’t have La Niña’s expected shifts in global temperature, rain, and other patterns to inform our winter outlooks.
Stay home and read
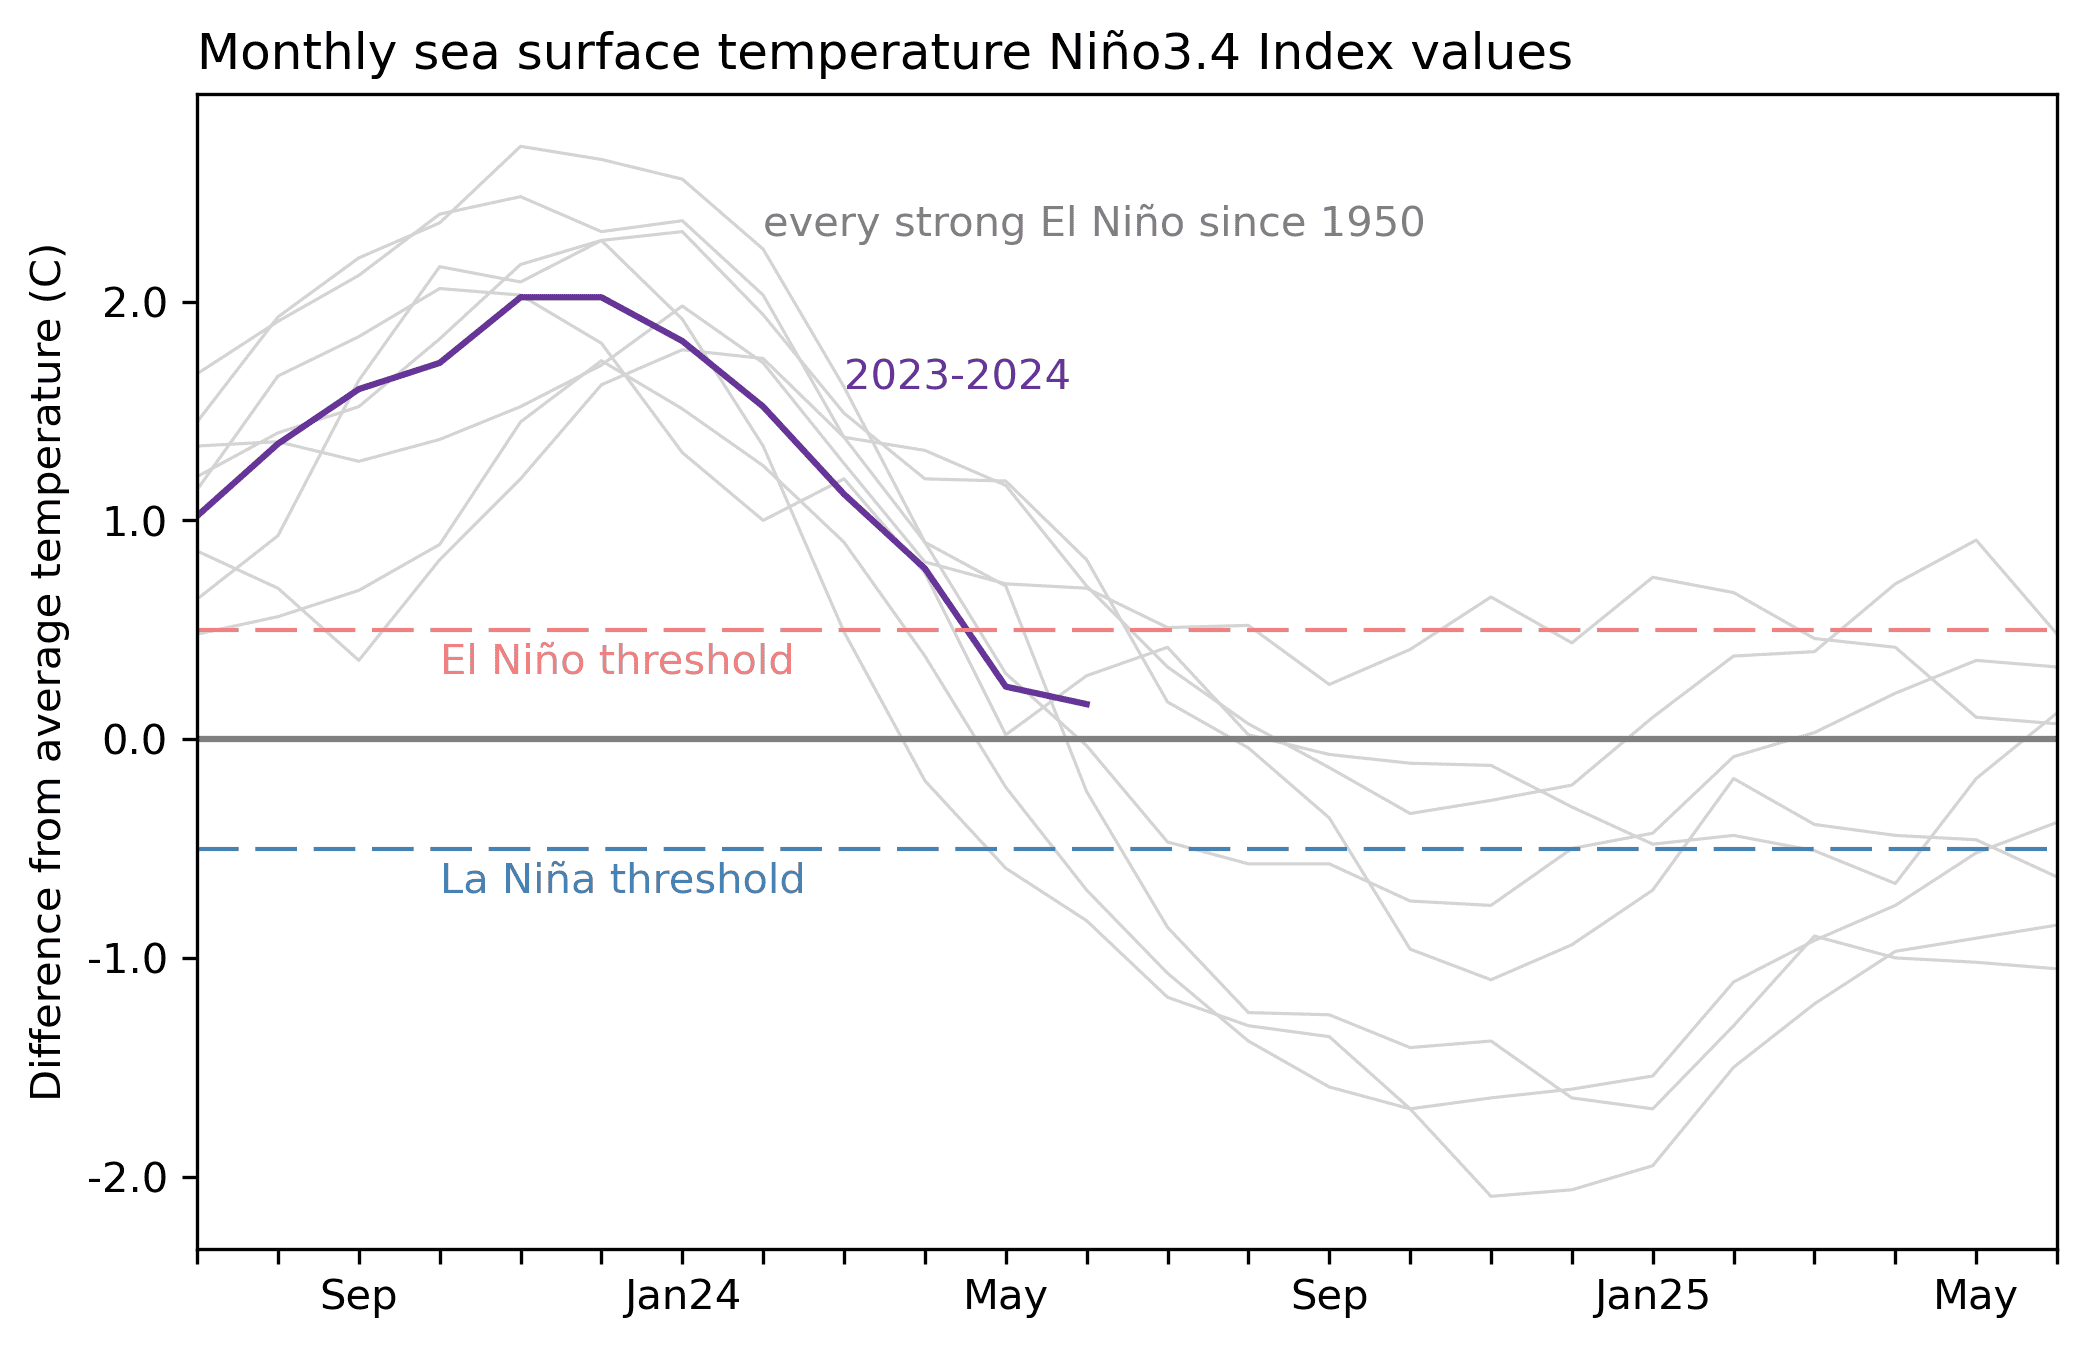
One of the (many, many) interesting things about being an ENSO forecaster is that ENSO is a seasonal phenomenon, meaning it changes slowly over many months (in climate prediction lingo, any three-month period is a “season”). Our number-one metric for ENSO is the Oceanic Niño Index (ONI), the three-month-average sea surface temperature in the Niño-3.4 region; you can find the historical record of the ONI going back to 1950 here.
To qualify as an El Niño and be colored red in the historical record, we need to see the ONI stay above the El Niño threshold (+0.5 °C) for at least five seasons in a row. The same is true for La Niña, except that’s blue in our record, and the threshold is -0.5 °C. The seasonal aspect is critical because, as I mentioned above, ENSO is a coupled system. It takes time for this relationship to develop and more time to transmit ENSO impacts around the world.
However, we issue forecasts every month and even monitor ENSO weekly. However, weekly data can be very noisy, and the sea surface temperature can wiggle around. For example, the most recent weekly Niño-3.4 value was 0.3 °C above average, slightly increasing from the previous couple of weeks. Does that mean El Niño is coming back? Not likely! It’s part of the random variability that we expect to see.
Also, we declare the onset of El Niño, La Niña, or neutral based on monthly averages—i.e., we don’t wait until we see a three-month-average that meets the criteria. If we did, we’d always be way behind! If we say there’s a 70% chance for La Niña to develop during August–October, we’re saying that we expect to meet our La Niña flowchart criteria sometime during that period. At the height of El Niño, in January, ENSO forecasters thought there was at least a 70% chance El Niño would end, and neutral conditions take over in the April–June period. As it turned out, that transition occurred in May, and the April–June Oceanic Niño Index was 0.4, our first neutral “season.” We’ll take the win!
Travel the world
We monitor ENSO in the tropical Pacific, but ENSO’s impacts resonate around the globe.
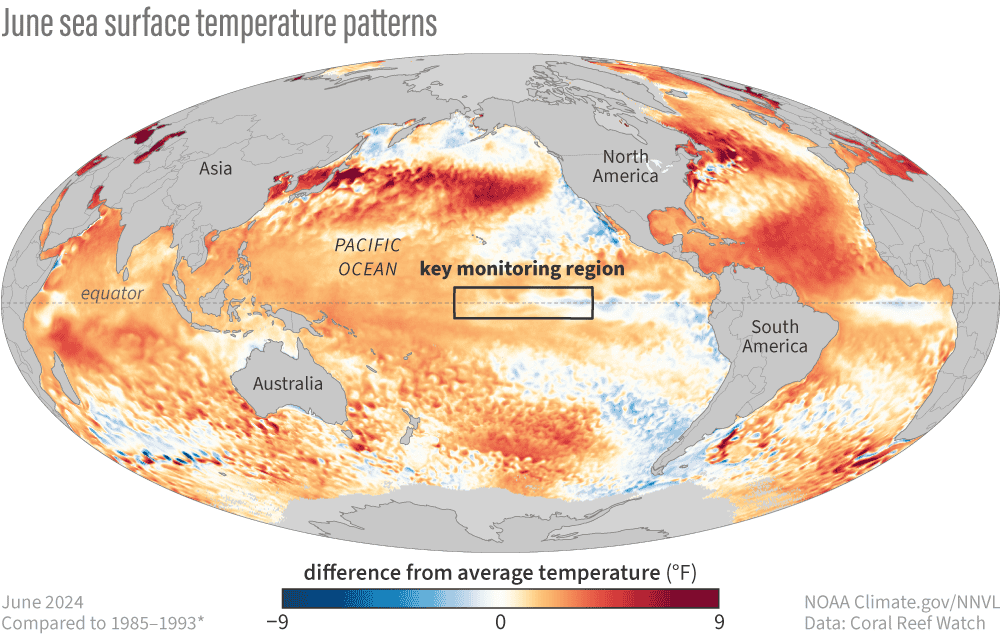
One known impact is La Niña’s contribution to a more active Atlantic hurricane season. Also, as shown in the above map, the Atlantic is very warm, which can feed hurricanes. Be sure to check out our recent guest post by Matt Rosencrans on NOAA’s outlook for the hurricane season. Later this month, we’ll have a guest post by the University of Arizona’s Derek Lemoine on how ENSO impacts the financial markets! Enjoy your (Northern Hemisphere) summer, and I’ll see you next month!
This post first appeared on the climate.gov ENSO blog and was written by Emily Becker.