This post first appeared on the climate.gov ENSO blog and was written by Nat Johnson
The recent bushfires in Australia have left a trail of destruction, gripping the world with infernal images of widespread devastation. The catastrophic bushfire season resulted from extremely hot and dry weather in spring and early summer throughout the country. As is usually the case, such extreme conditions involve several factors working together, including human-caused global warming as well as naturally occurring weather and climate patterns.
One of those important factors was an extreme Indian Ocean Dipole (IOD) event, a phenomenon we have mentioned previously but not in-depth. If you were hoping for a bit more background on this pattern, then you’ve come to the right place!
New kid on the block
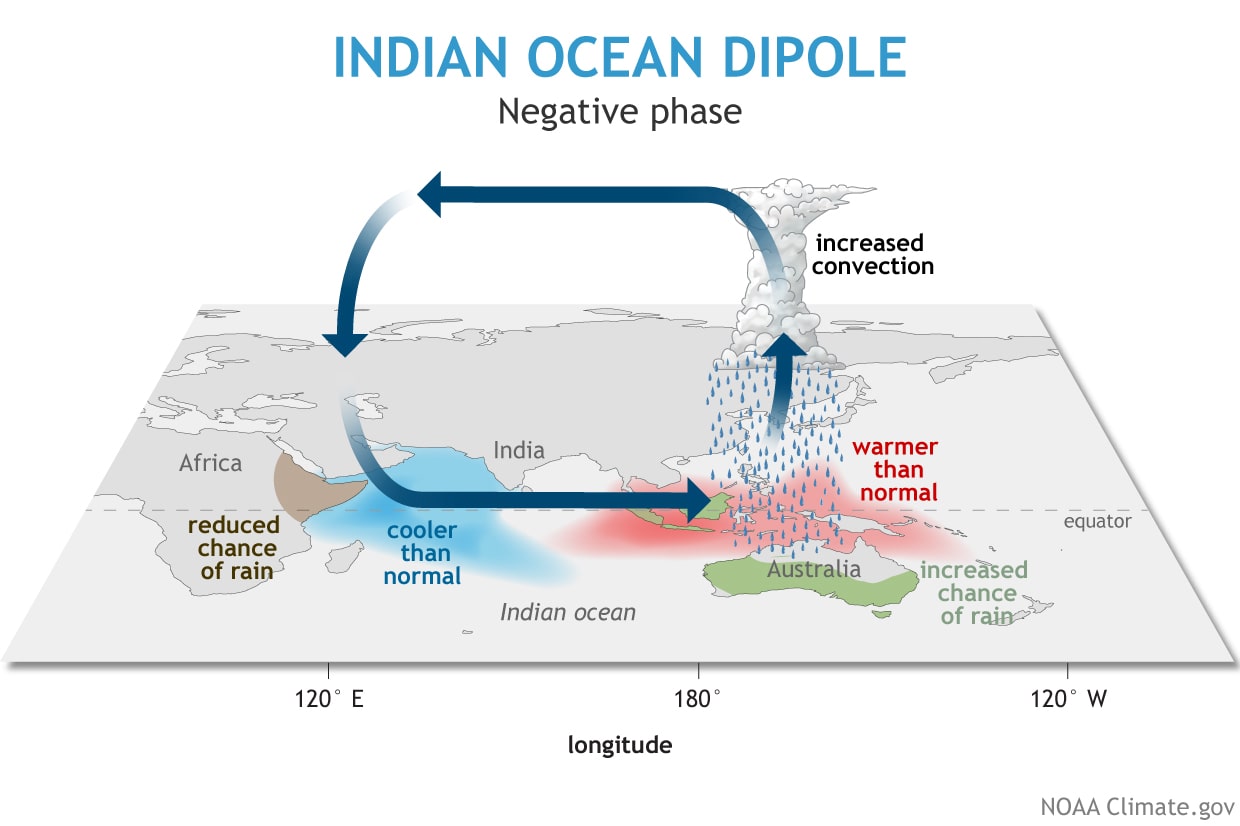
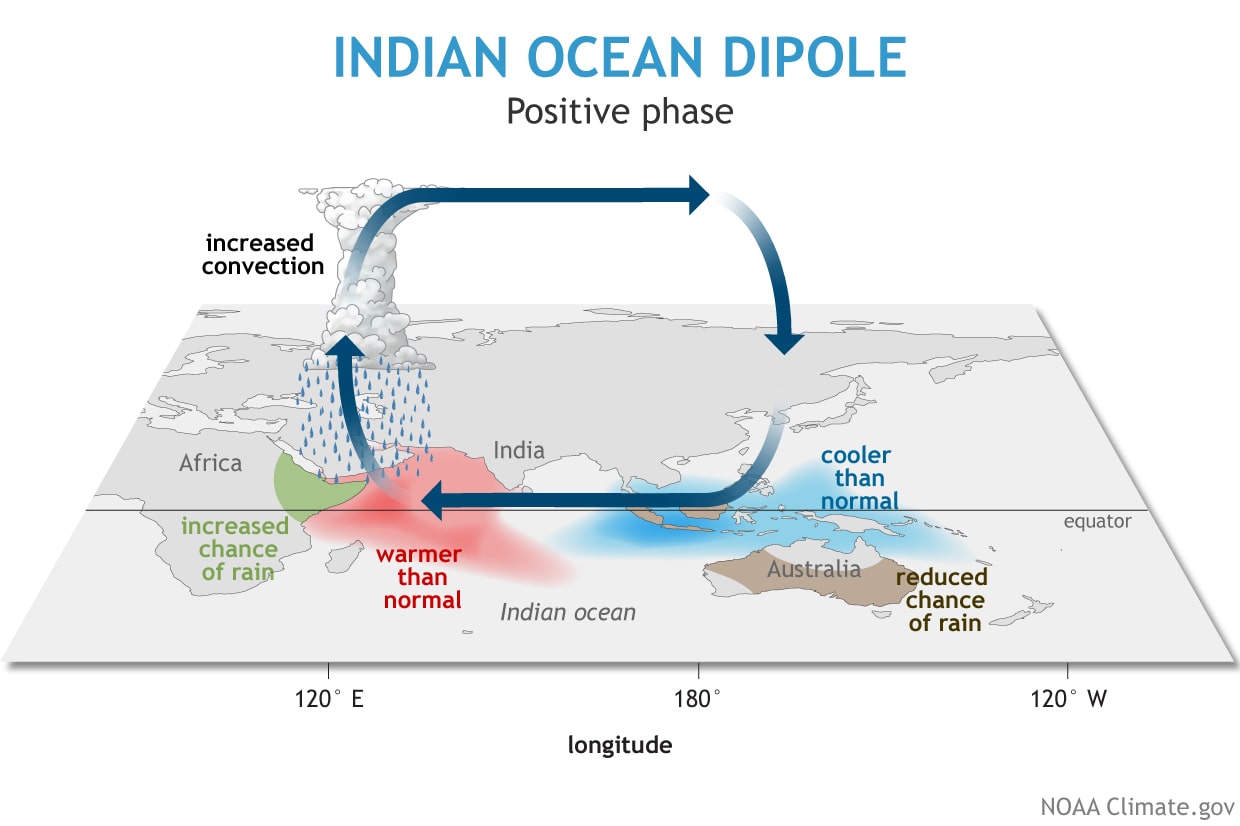
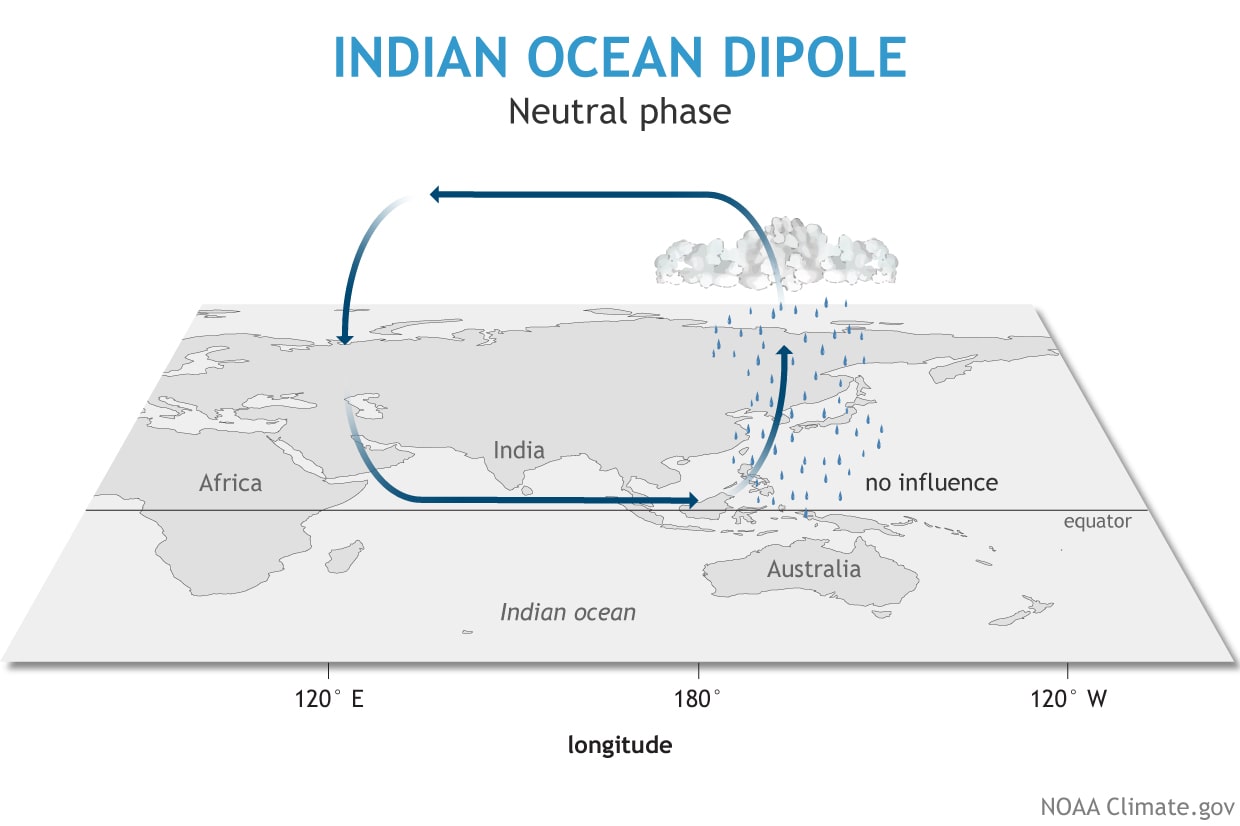
The IOD has only been recognized for about 20 years (1), making it much less studied than many other climate patterns, including ENSO. During the positive phase of the IOD (like what happened in the Southern Hemisphere winter and spring of 2019), cooler-than-normal sea surface conditions in the eastern Indian Ocean near Java and Sumatra accompany warmer-than-normal conditions in the western tropical Indian Ocean. This east-west contrast in ocean conditions (a “dipole”) alters the wind, temperature, and rainfall patterns in the region, typically bringing floods to eastern Africa and droughts and bushfires to eastern Asia and Australia, among other ecological and socio-economic impacts. During the negative IOD phase, the locations of the warm/cool pattern and associated impacts reverse. As with ENSO, the growth of these IOD conditions require the cooperation between the atmosphere and ocean (2).
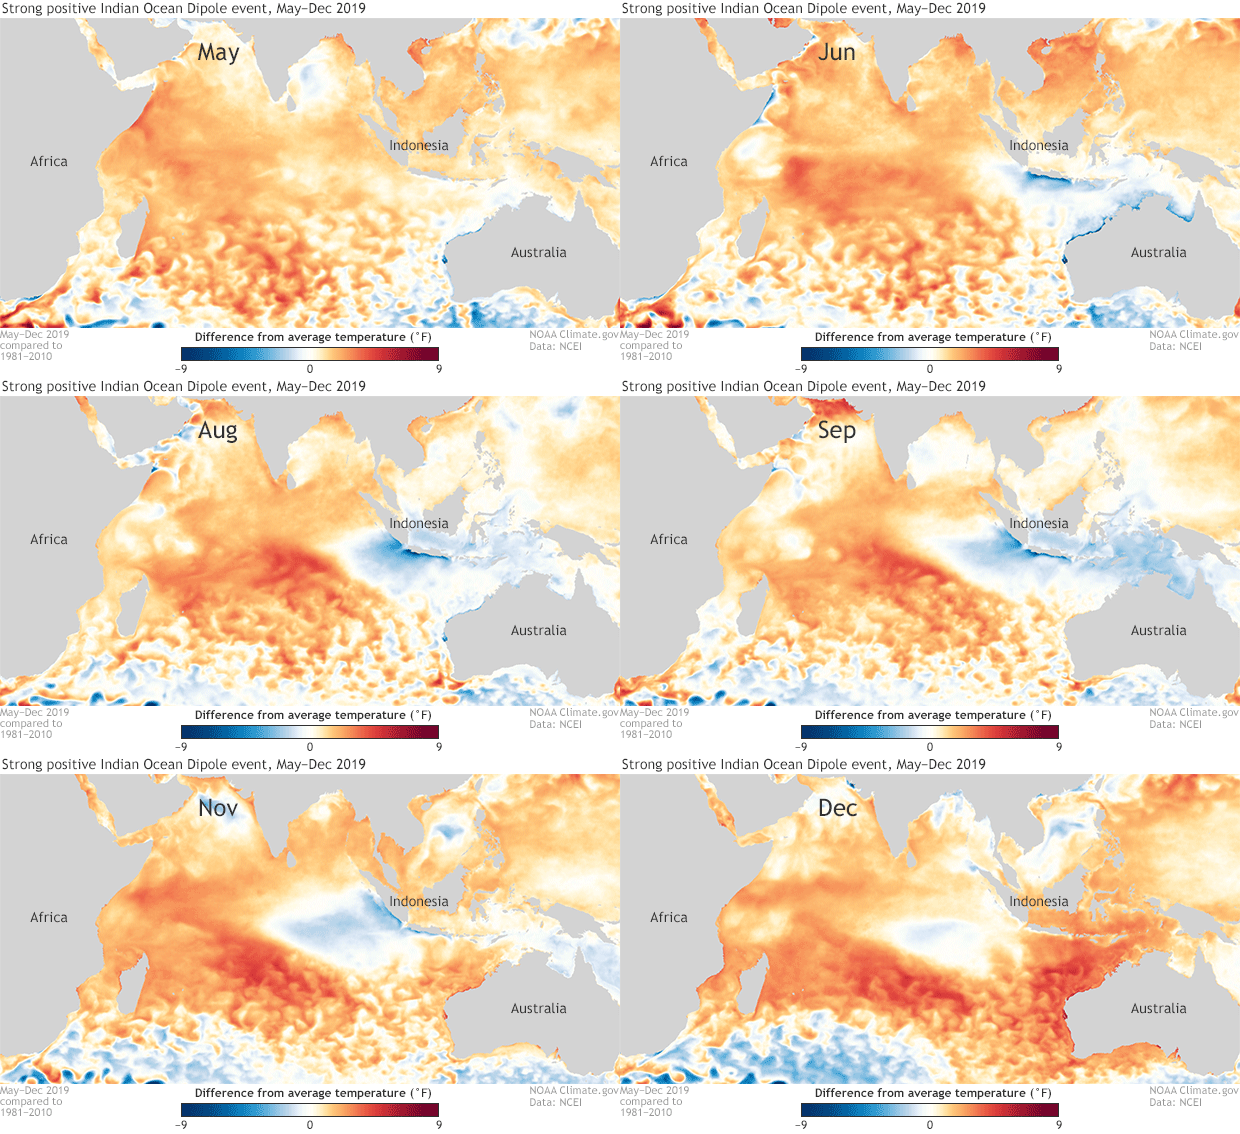
By June of 2019, we began to see the development of cooler-than-normal sea surface temperatures off the Java coast, indicating the initiation of the latest positive IOD event. In the following few months, the region of below-average temperatures rapidly intensified and expanded northward off the western coast of Sumatra. With positive temperature departures intensifying in the western Indian Ocean, the east-west contrast of Indian Ocean temperature departures peaked in austral spring before rapidly weakening in December.
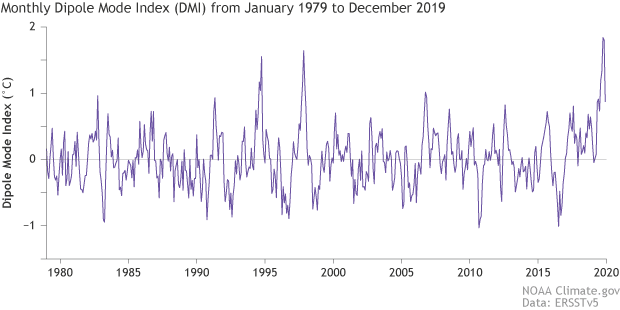
Typically, the strength of the IOD is monitored with the so-called Dipole Mode Index, which is a measure of the surface temperature difference between the western and eastern tropical Indian Ocean. The monthly Dipole Mode Index time series reveals other extreme positive phase IOD events, like in 1994 and 1997, but 2019 brought the most extreme event over the past 40 years, at least according to this particular index. This event reached its peak in October and November before rapidly weakening in December—a rather typical seasonal evolution for an IOD event. According to the Australian Bureau of Meteorology, which regularly monitors the IOD, the current Dipole Mode Index is near zero (3), indicating that the IOD has returned to neutral conditions.
Standing on ENSO’s turf?
The discovery of the IOD raised a considerable amount of interest but also a great deal of scientific debate about whether it is a unique climate pattern or even truly a dipole. Much of this debate centers on the close connection between ENSO and the IOD, as ENSO is one of the main triggers of IOD events. During El Niño, the anomalous (departure from average) surface winds near Indonesia blow from southeast to northwest, helping to bring cold water to the surface near Java and Sumatra and initiating a positive IOD event, like what we saw with the extreme IOD event of 1997. Similarly, La Niña tends to trigger negative IOD events.
Because of this close connection, it becomes challenging to determine how much IOD variability is separate from ENSO variability (4). Nevertheless, the latest event confirmed that, at least on occasion, it’s possible to have an extreme IOD event in the absence of El Niño or La Niña, given that ENSO has been stuck in neutral since the Northern Hemisphere summer (5). A few studies even suggest that the IOD may influence the evolution of ENSO (6), and so the ENSO/IOD connection might be a two-way street.
Impacts on the Australian bushfires
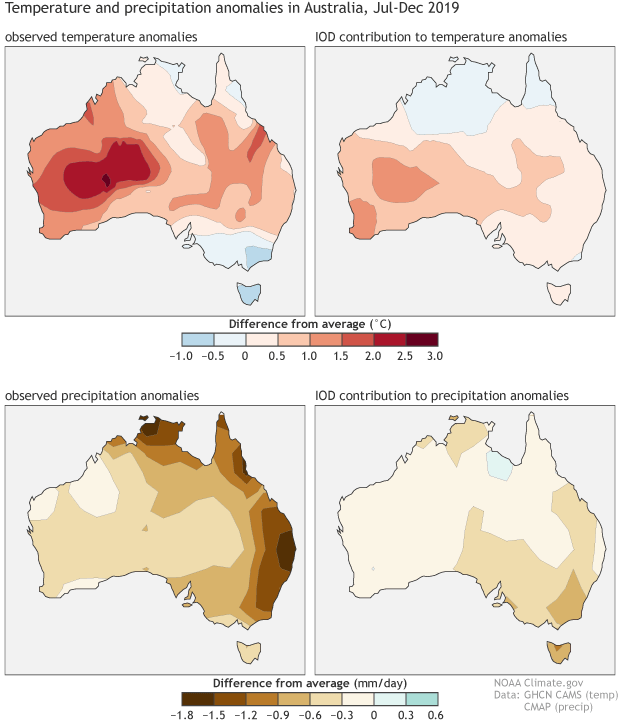
How much did this extreme positive IOD event influence the conditions that led to Australia’s catastrophic bushfire season? A definitive answer to that question requires a considerable amount of scientific investigation, and so we won’t reach a firm conclusion in this blog post (sorry!). However, we can get a ballpark estimate with an approach that Michelle and I have used previously, which is to use historical relationships to calculate the IOD influence on Australia’s recent temperature and precipitation patterns (7).
Australia was extremely warm and dry in austral winter and spring, setting the stage for a destructive bushfire season. According to my calculations, the extreme positive IOD made a substantial contribution to these conditions, especially to the warmth in the west and the dryness in the east. Although these IOD contribution calculations only provide a rough estimate, the main conclusion is likely to hold under scrutiny: the extreme positive IOD event was a major player in Australia’s catastrophic bushfire season, but it was not sufficient on its own to produce the extreme conditions Australia experienced (8). This underscores my earlier point that such extreme conditions usually require several different factors working together.
The future of the Indian Ocean Dipole
Does human-caused climate change have any effect on the IOD? Like we have discussed numerous times about ENSO (see here, here, and here), the short answer is that it’s complicated! However, a recent study argues that extreme positive IOD events, like we just experienced, will occur almost three times as often in the 21st century relative to the 20th century. That means we would experience an extreme positive IOD event about once every 6 years in this century, potentially bringing more frequent floods, droughts, and bushfires like what we have just witnessed.
The final word on the science of the IOD has yet to be uttered, so we’ll be looking out for the latest research. And as we keep our eyes glued to the tropical Pacific for the latest ENSO developments, we’ll be sure to take a glance over at the Indian Ocean – ENSO’s neighbor can have a lot going on!
Footnotes
- Two articles published at the same time in 1999 are recognized as the seminal studies of the Indian Ocean Dipole.Saji, N. H., B. N. Goswami, P. N. Vinayachandran, and T. Yamagata, 1999: A dipole mode in the tropical Indian Ocean. Nature, 401, 360-363. doi:10.1038/43854.Webster, P. J., A. M. Moore, J. P. Loschnigg, and R. R. Leben, 1999: Coupled ocean-atmosphere dynamics in the Indian Ocean during 1997-98. Nature, 401, 356-360. doi:10.1038/43848
- This process is called “Bjerknes feedback,” as Michelle briefly described in this post.
- The Dipole Mode Index reported by the Australian Bureau of Meteorology is not expected to be identical to the values shown in this post due to differences in the sea surface temperature data used to construct the index. I calculated the index with monthly ERSSTv5 temperature anomaly data that use 30-year base periods updated every five years.
- For example, a relatively recent study, Zhao and Nigam (2015), suggests that the dipole temperature pattern vanishes after removing the influence of ENSO, but the strength of this conclusion may depend on the method of removing the ENSO influence (compare with Yang et al., 2015).Yang, Y., S.-P. Xie, L. Wu, Y. Kosaka, N.-C. Lau, and G. A. Vecchi, 2015: Seasonality and predictability of the Indian Ocean Dipole mode: ENSO forcing and internal variability. Journal of Climate, 28, 8021-8036. doi:10.1175/JCLI-D-15-0078.1Zhao, Y., and S. Nigam, 2015: The Indian Ocean Dipole: A monopole in SST. Journal of Climate, 28, 3-19. doi:10.1175/JCLI-D-14-00047.1
- However, it’s worth noting that we were in the tail end of a weak El Niño when this IOD event began, and so we cannot rule out an ENSO influence even in this case.
- In fact, Izumo et al. (2010) suggest that the state of the IOD combined with ocean temperature information can be used to predict ENSO more than one year in advance. The positive IOD tends to precede the occurrence of La Niña over a year later, so we are curious to see if this tendency holds for next fall and winter in the Northern Hemisphere. However, as mentioned above, it can be tricky disentangling what is truly an influence of the IOD rather than just a part of the ENSO cycle that is separate from the IOD (see, for example, Stuecker et al., 2017).Izumo, T., J. Vialard, M. Lengaigne, C. de Boyer Montegut, S. K. Behera, J.-J. Luo, S. Cravatte, S. Masson, and T. Yamagata, 2010: Influence of the state of the Indian Ocean Dipole on the following year’s El Niño. Nature Geoscience, 3, 168-172. doi:10.1038/NGEO760Stuecker, M. F., A. Timmermann, F.-F. Jin, Y. Chikamoto, W. Zhang, A. T. Wittenberg, E. Widiasih, and S. Zhao, 2017: Revisiting ENSO/Indian Ocean Dipole phase relationships. Geophysical Research Letters, 44, 2481-2492. doi:10.1002/2016GL072308
- If you’ve made it this deep into the footnotes, then you must really like technical details. I’m glad you’re here! As in the other posts mentioned above, I used a method called least squares linear regression to calculate the IOD contributions to Australia’s July – December 2019 temperature and precipitation patterns. The strength of the IOD was measured with the Dipole Mode Index. Because the IOD and ENSO are closely connected, as discussed above, I needed to perform an intermediate calculation that removes the influence of ENSO from the Dipole Mode Index, Australian near-surface air temperature, and precipitation data. For this intermediate step, I used least squares linear regression again to subtract the influence of the July – September Niño 3. 4 index from the Dipole Mode Index and the gridded temperature and precipitation data. I acknowledge that ENSO is a complex climate pattern that evolves in space and time, and so the method I chose may not be the only or best method. However, Zhao and Nigam (2015) showed similar results using this approach compared with a more complicated method, so I concluded that my approach was good enough for the purposes of obtaining the ballpark estimates I wanted. However, it is important to keep in mind the assumptions that went into my calculations, namely that the relationships between ENSO and the IOD and between the IOD and Australian climate are linear. That almost certainly is not true in a strict sense, and so that is why these calculations can only be considered a rough estimate at best.
- Another important factor likely was an unusually weak stratospheric polar vortex in the Southern Hemisphere, which can lead to hot and dry weather over Australia.