This post first appeared on the climate.gov ENSO blog and was written by Emily Becker.
There’s a 57% chance La Niña will develop soon. This is late for La Niña to arrive, and it’s very likely to be a weak event at most. However, even a weak event can influence temperature, rain, and snow patterns across the world. Today, we’ll take a tour through current conditions in the tropical Pacific and consider some of the things that might be interacting with La Niña’s development.
First things first: what’s ENSO, and why do we care so much about it?
La Niña, the cool phase of the El Niño/Southern Oscillation (ENSO), features cooler-than-average surface temperature in the tropical Pacific Ocean. The warm phase, El Niño, includes warmer-than-average surface waters, and ENSO-neutral is when the surface temperature is close to average. These shifts in the temperature of the central and eastern tropical Pacific change the pattern of rising air in that region, with La Niña’s cooler waters leading to less rising air and storms. The atmospheric circulation over the tropics drives patterns around the world, including the jet streams and storm tracks. So, when La Niña or El Niño alter the tropical circulation, global circulation is shifted in known ways. Since ENSO can be predicted months in advance, it can give us an early idea of upcoming changes in temperature and rain/snow patterns.
Where are we now, ENSO-wise?
Our primary ENSO metric is the temperature of the sea surface in the part of the east-central tropical Pacific known as the Niño-3.4 region.
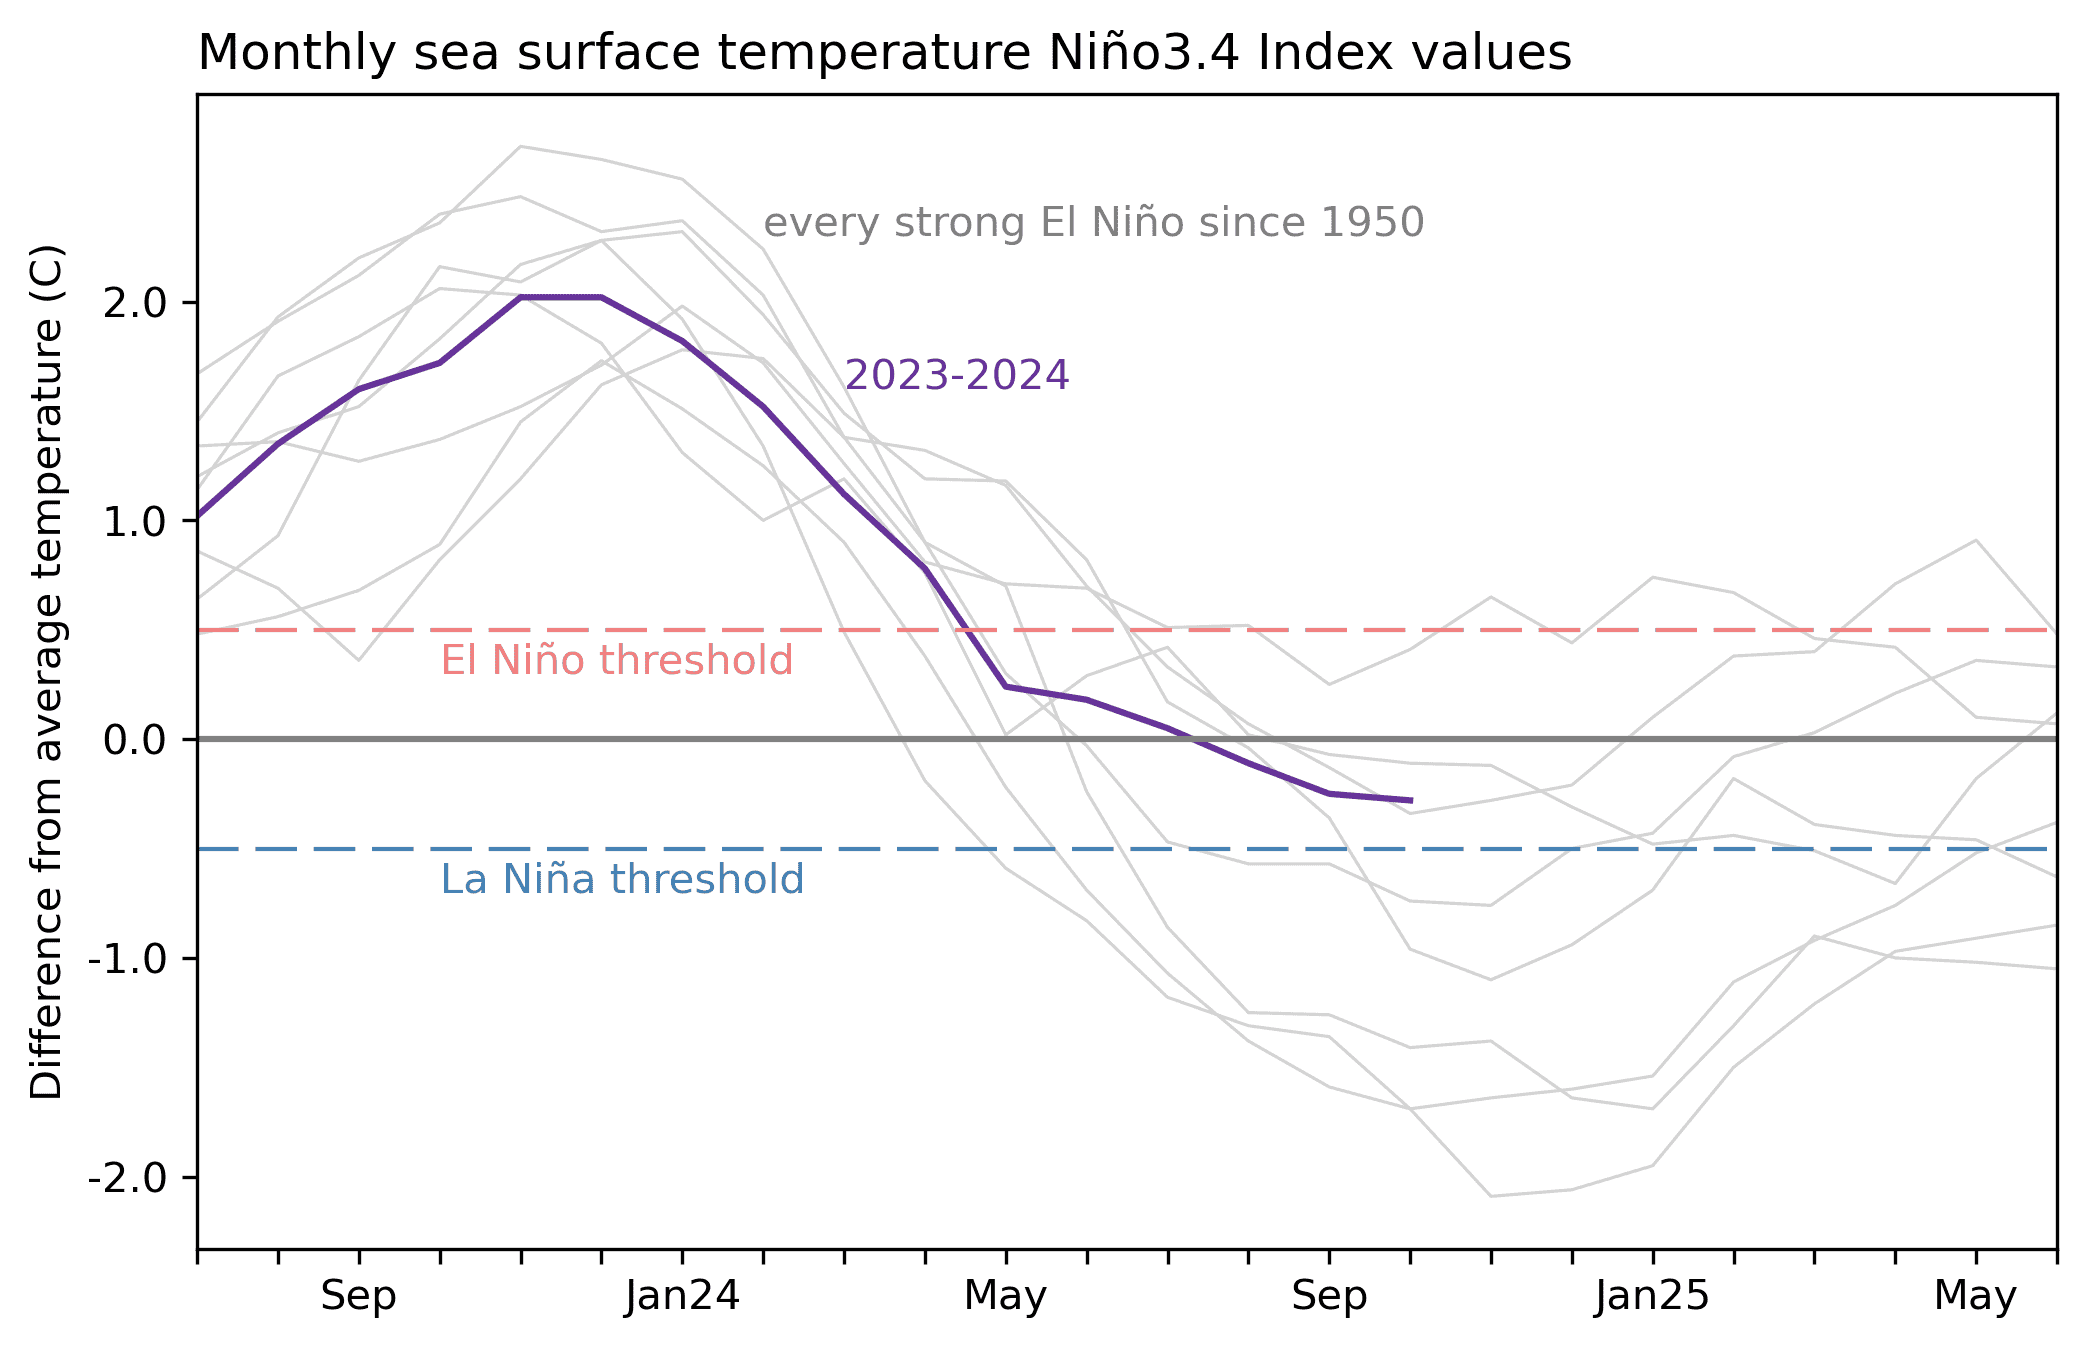
To qualify as La Niña conditions, the east-central tropical Pacific needs to be at least 0.5 °C (0.9 °F) cooler than the long-term average (long-term=1991–2020). We use the term anomaly whenever we’re talking about the departure from the average. For example, the anomaly in the Niño-3.4 region was -0.28 °C in October, according to ERSSTv5, our most reliable dataset of observations of ocean surface temperature. Since La Niña requires an anomaly of at least -0.5 °C, the tropical Pacific is still ENSO-neutral.

What’s coming up?
We’ve been saying it for months, and we are saying it again: Forecasters still think La Niña will develop and last through the winter. Overall, our computer climate models are still predicting the sea surface temperature will cross the La Niña threshold. There is cooler-than-average water under the surface of the tropical Pacific, too, which can well up and renew the cool anomaly at the surface. However, this is pretty late in the year for La Niña to develop—only two La Niñas in our 75-year historical record have formed in October–December. ENSO events reach their peak strength in the winter, so there isn’t much time for La Niña to strengthen. Computer models are predicting a weak La Niña, meaning a Niño-3.4 anomaly between -0.9 °C and -0.5°C.
What are the implications of a weak La Niña?
Weak events can still shift global atmospheric circulation and produce some typical La Niña impacts, like a drier winter across the southern tier of the U.S. However, a weak event means ENSO’s influence is also weaker, leaving room for other weather and climate patterns to make their mark.
Why’s it so late?
That’s the $64,000 question! After last winter’s El Niño dissipated, the Niño-3.4 anomaly did drop below zero (i.e., below average), but it just hasn’t quite cooled as much as we expected. Despite being such a large area, unpredictable small shifts in the winds and ocean currents can affect the growth of ocean temperature anomalies. Recently, the Madden-Julian Oscillation (MJO), a region of storms that travels eastward around the equator, was active, passing through the tropical Pacific over a couple of weeks in October. The winds associated with the MJO can cause the surface water to warm or cool. However, the MJO is not the primary culprit in this delayed La Niña.
Does all-over-ocean-warming have something to do with this?
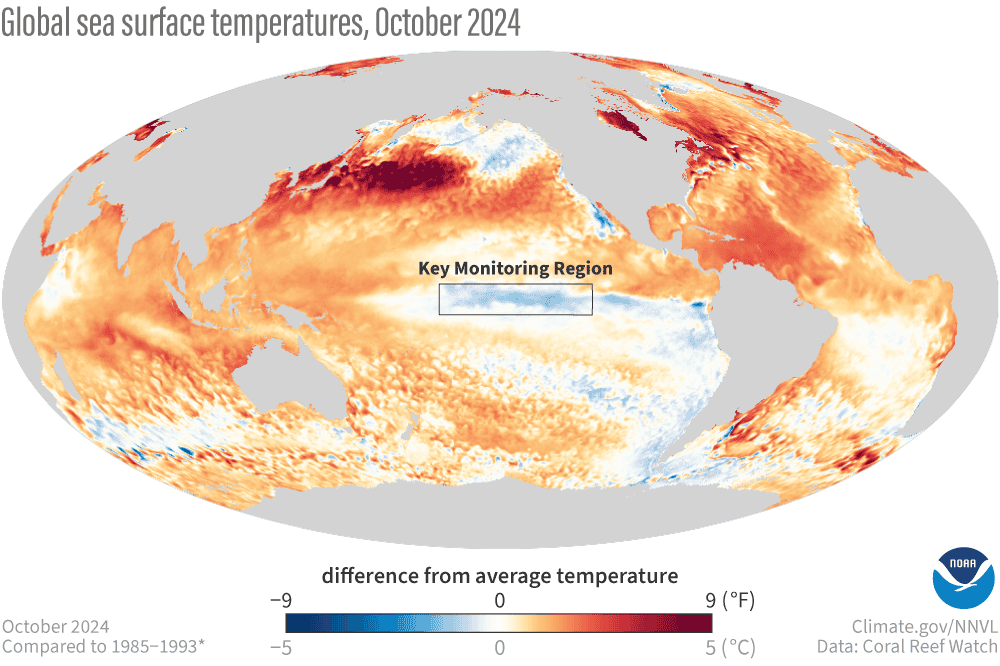
If you look at that map above, you can’t miss all those positive anomalies—the global oceans are so much warmer than average. In fact, the east-central Pacific is one of only a few spots of negative (cool) temperature anomalies (blue). We’re still learning how human-caused global warming affects ENSO in general, and it will take a lot more research to understand how the strong global anomalies affected this ENSO cycle specifically. However, when we compare that little spot of negative anomalies in the central-eastern tropical Pacific with the rest of the tropical oceans, we find what could be a piece of the puzzle.

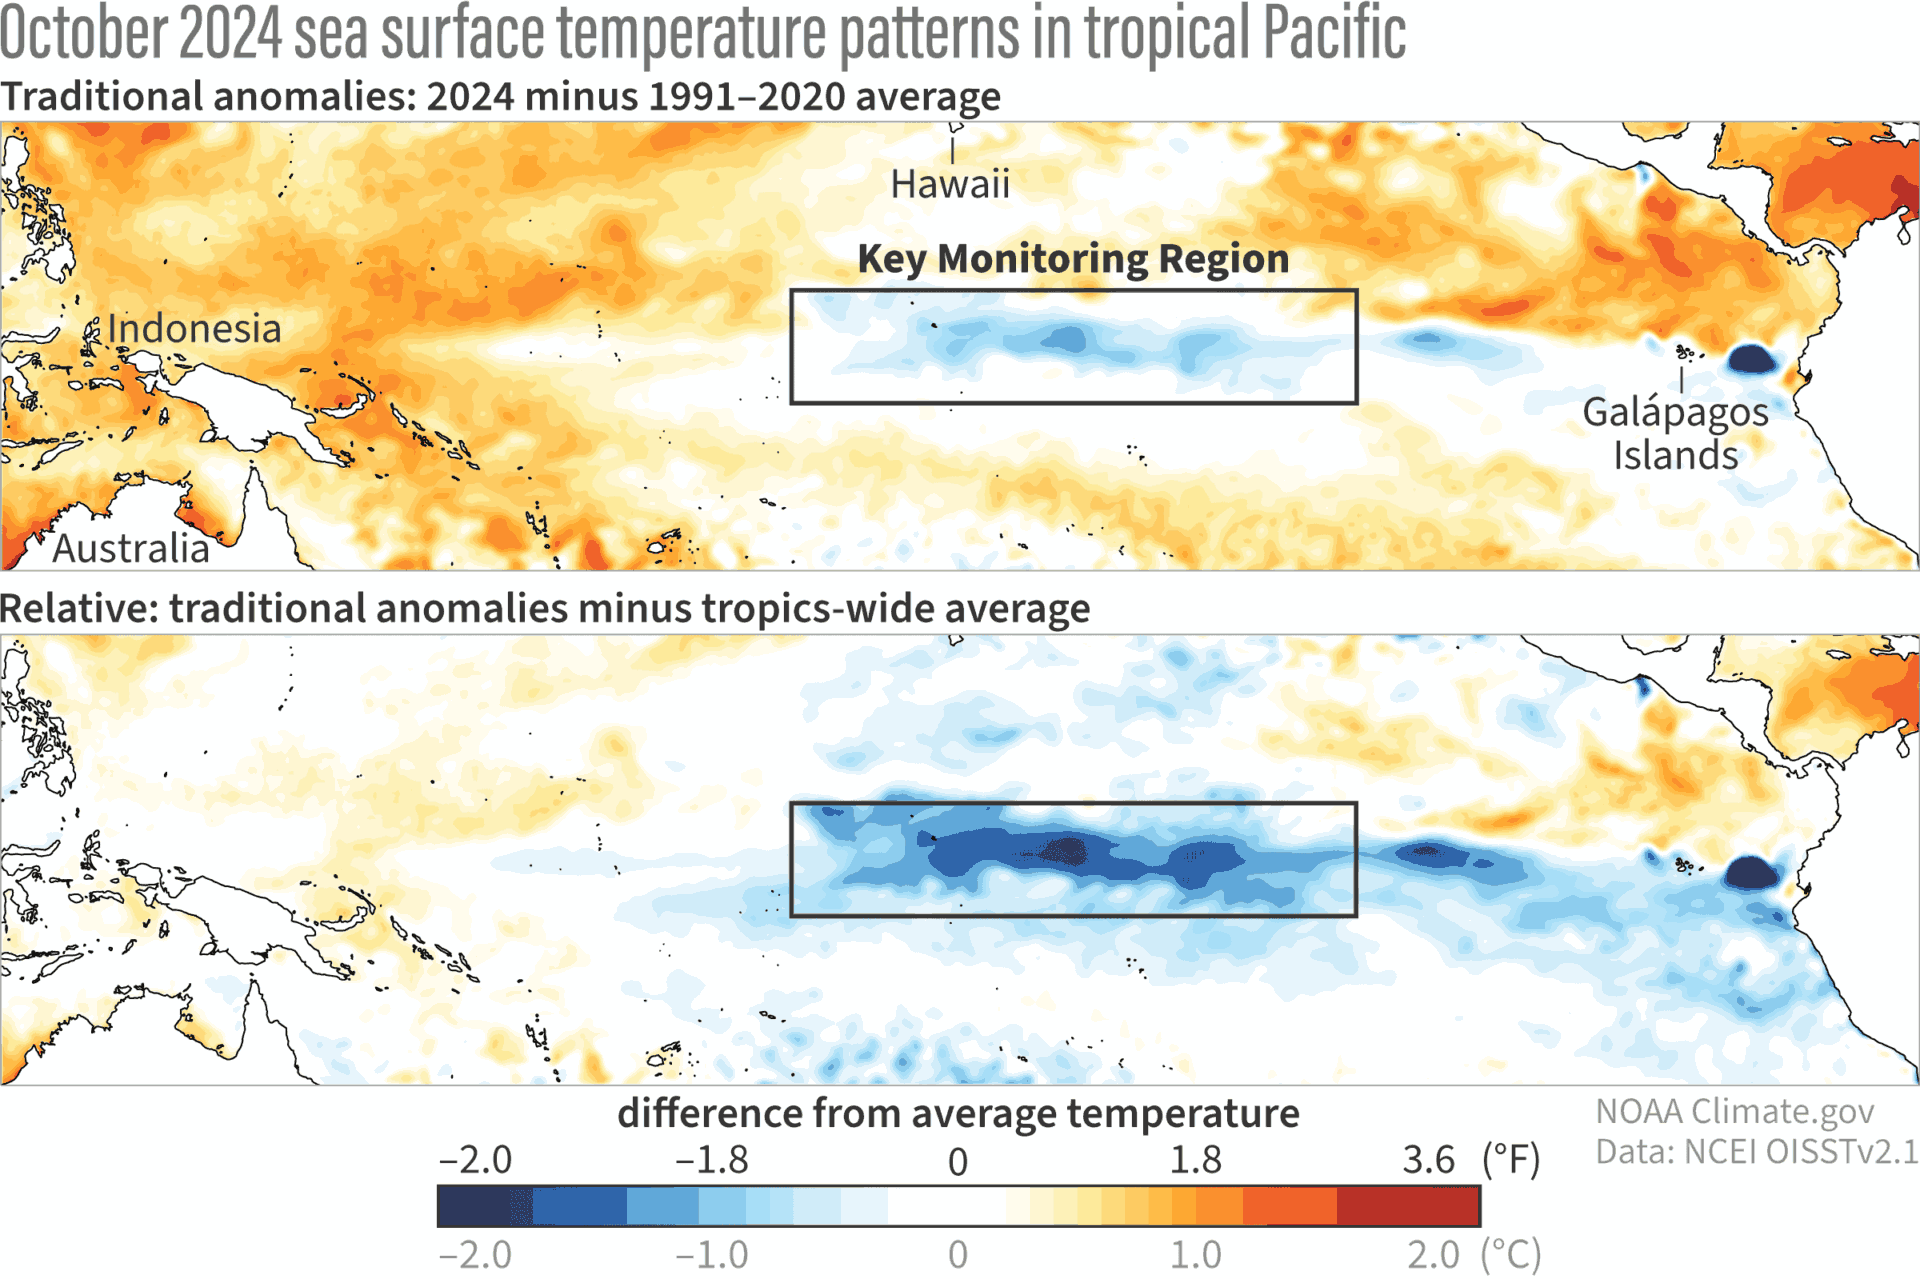
The first map above is our regular temperature anomaly map, where each location shows the departure from the local long-term average. (It’s very similar to the global map from earlier, but not identical, because they use different datasets.) The second map here shows what happens when you also subtract the average anomaly of the entire tropics (see footnote). Since most of the tropics are warm (red), this map shows not only how cool the Niño-3.4 region is compared to average, but how cool it is relative to the rest of the tropics.
With the rest of the tropics warmer, the cold anomaly in the east-central really stands out. This relative difference in temperature between the ENSO region and the rest of the tropics is really important for driving the atmospheric changes in the tropics that affect global weather and climate. With a strong relative anomaly in place, the atmosphere may start responding in a La Niña-like way, regardless of the official metric. And that is what we are seeing.
For a couple months now, we’ve been seeing suppressed rainfall and convection (rising air) around the Date Line, which is one hint that the tropical atmosphere is already responding to the locally cool sea surface temperatures. We have also seen positive values of the Equatorial Southern Oscillation Index, which says sea level pressure has been lower over Indonesia and higher over the eastern Pacific Ocean. In other words, the tropical atmospheric response looks more consistent with the stronger relative cooling in the central-eastern Pacific rather than the weak absolute cooling reflected in the standard Niño-3.4 index. For more detail, check out Michelle’s excellent post on the relative sea surface temperature.
Do you measure this relative ENSO index?
We do! The relative Niño-3.4 for October—the average across the Niño-3.4 box for the second map here—was -0.87 °C, much stronger than the -0.28 °C from the traditional method. So yes, the relative measurement might be reflecting La Niña, while the traditional measurement is still neutral! This relative index is not NOAA’s official metric, though, because it is a newer index and is still being studied and evaluated. Michelle and many of our colleagues are working on confirming that the relative index better matches global ENSO impacts in our changing climate.
What does this all mean for the upcoming winter?
Stay tuned! In a couple of weeks, Nat will take a look at what our climate models have to say about the winter outlook, including if the models are expecting more La Niña-like impacts that line up better with the relative measurement than the traditional one. The only thing we can say for certain is that Nature is going to keep us guessing!
Footnote
After you subtract the tropical average (20°S–20°N) sea surface temperature anomalies, the difference has lower variance than the original SST anomalies. This is why the computation of relative Niño-3.4 also has a variance adjustment where you multiply by a scaling factor (ratio of the standard deviation of the SST anomaly with the standard deviation of the difference index). If you want to see how this really works, here is some github code to compute relative ONI using observations. In the relative SST map above, the standard deviation of SST anomaly at each grid box is used instead of the standard deviation of the Niño-3.4 index.