What is La Niña?
The La Niña story
by NOAA
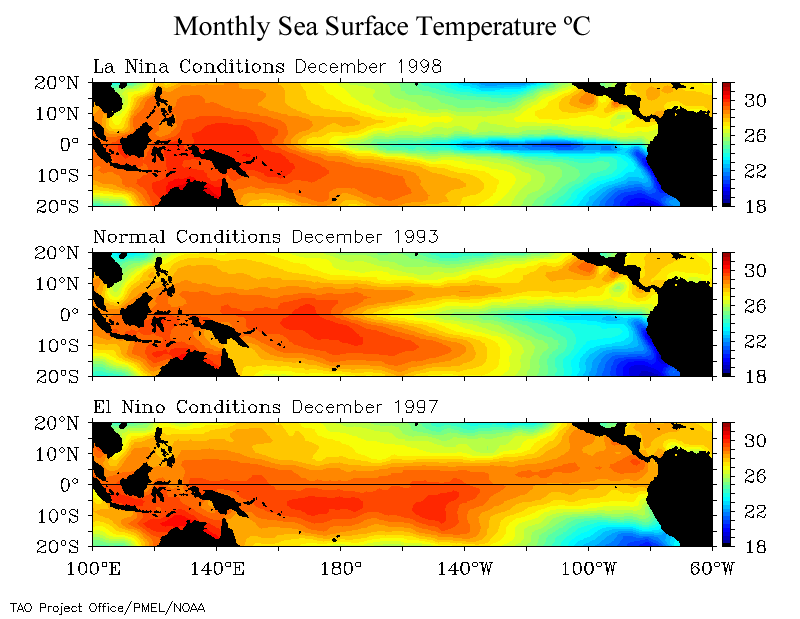
La Niña is characterized by unusually cold ocean temperatures in the Equatorial Pacific, compared to El Niño, which is characterized by unusually warm ocean temperatures in the Equatorial Pacific. The graphic below shows the sea surface temperature in the equatorial Pacific (20ºN-20ºS, 100ºE-60ºW) from Indonesia on the left to central America on the right.
Strong La Niña conditions during December 1998 are shown in the top panel. The Eastern Pacific is cooler than usual, and unusually cool water extends farther westward than is usual (see the blue color extending further off-shore from South America along the equator).
Normal Equatorial Pacific Ocean surface temperatures (December 1993) are shown in the middle panel, including the usual cool water, called the ‘cold tongue’, in the Eastern Pacific (in blue, on the right of the plot) and the usual warm water, called the ‘warm pool’ in the Western Pacific (in red, on the left).
Strong El Niño conditions, in December 1997, are shown on the bottom panel, with warm water (red) extending all along the equator.
El Niño and La Niña are opposite phases of the El Niño-Southern Oscillation (ENSO) cycle, with La Niña sometimes referred to as the cold phase of ENSO and El Niño as the warm phase of ENSO.
Historical La Niña and El Niño Events
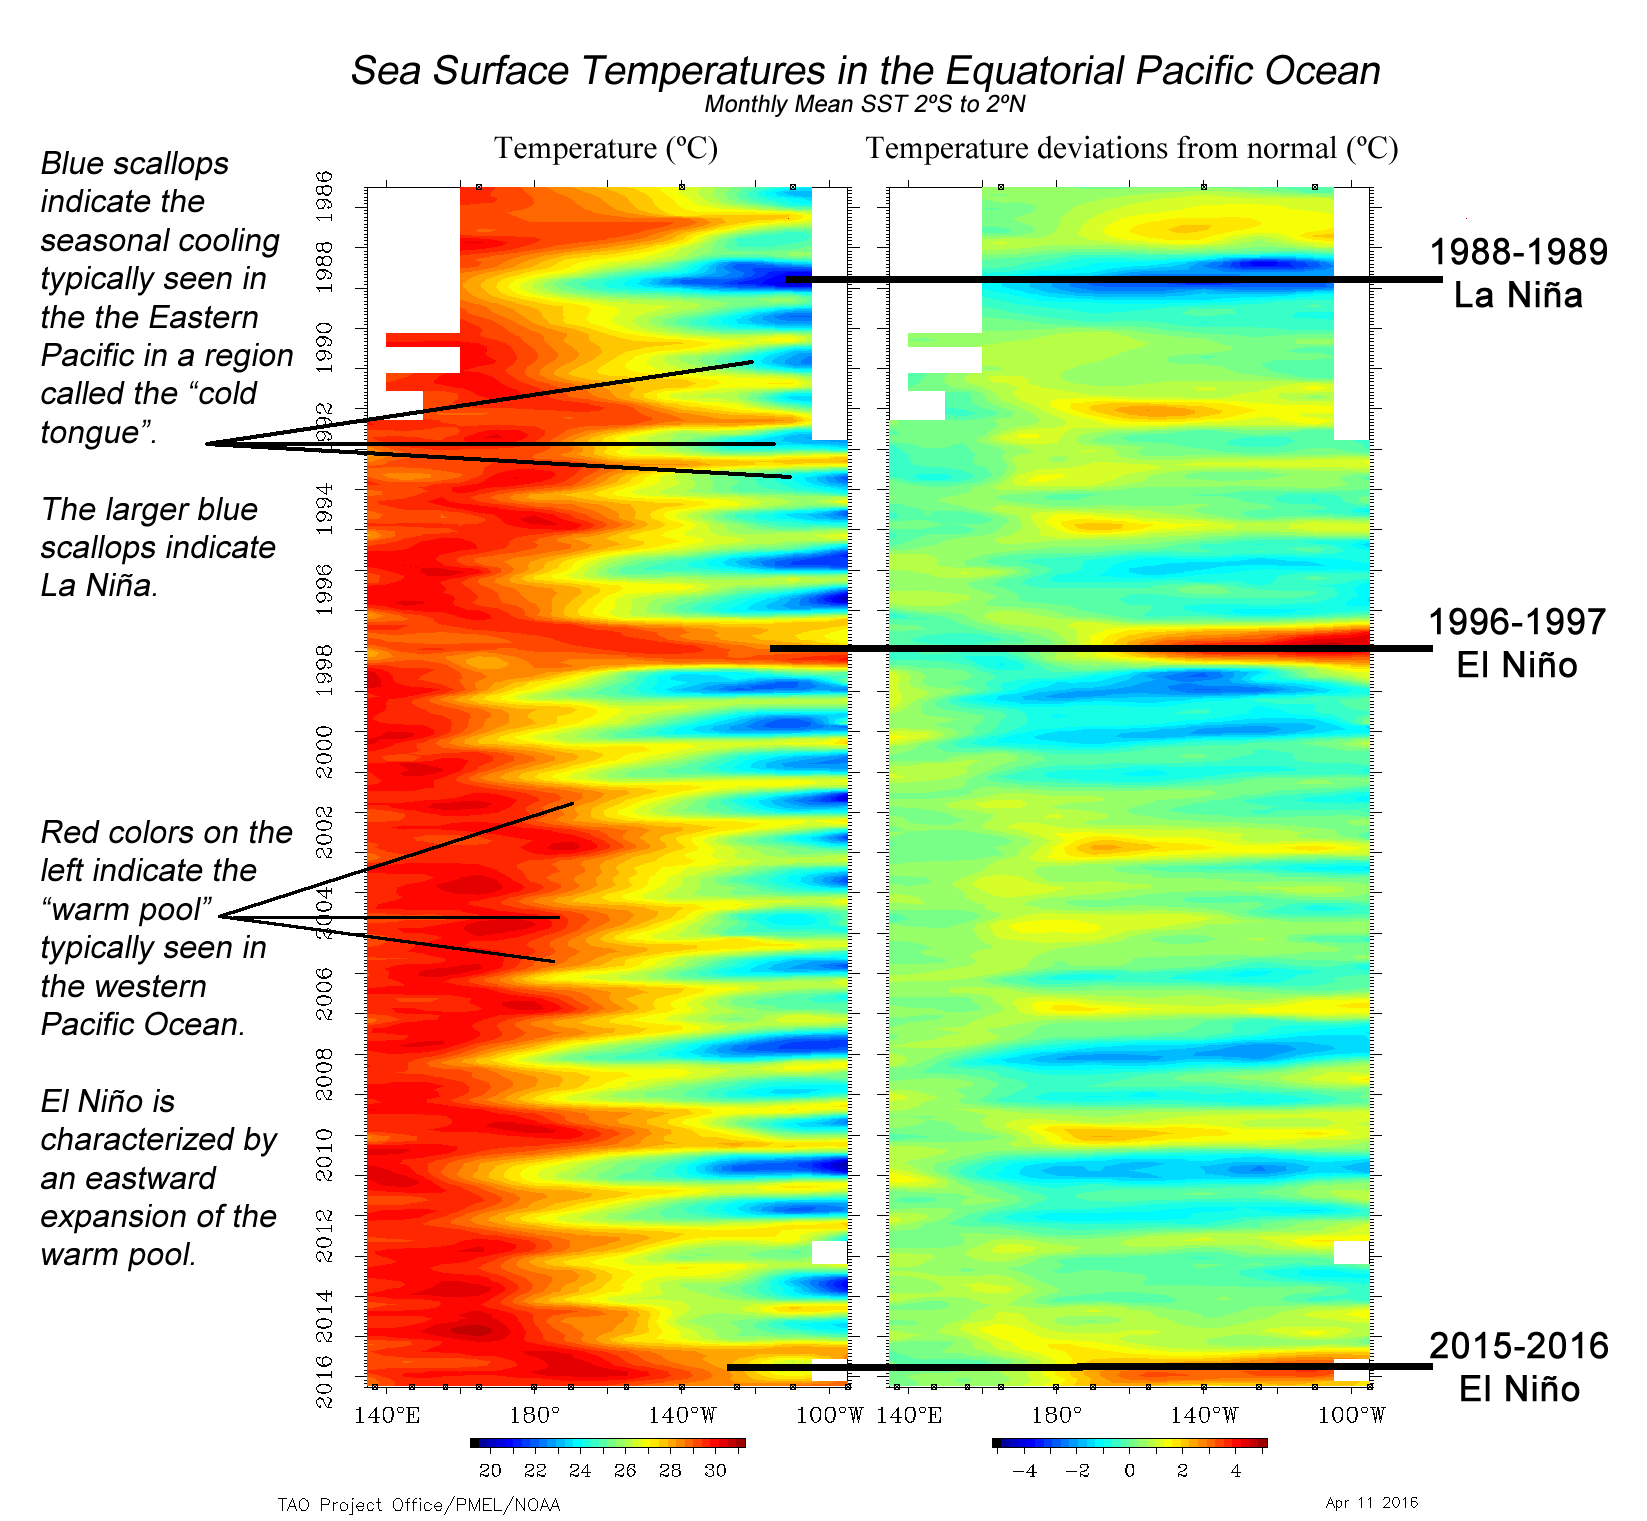
This graphic shows normal seasonal warming (red), cooling (blue), and El Niño and La Niña events from 1986 to 2016.
Along the left side is time, with 1986 at the top and 2016 at the bottom.
Both panels show sea surface temperature along the equator in Pacific Ocean, with Indonesia on the left (west) and South America on the right (east).
The left panel is the sea surface temperature, the right panel is the deviation of temperature from normal.
Left panel – Sea Surface Temperature
Mean seasonal cycle: The first thing to note is the blue “scallops” in the eastern Pacific (in the left panel, these are on the right side of the temperature plot). These indicate the cool water typically observed in the Eastern Pacific in a region called the “cold tongue”. Cold tongue temperatures vary seasonally, being warmest in the northern hemisphere springtime and coolest in the northern hemisphere fall. The red color in the western Pacific (on the left side of the temperature plot in the left panel) is the warm pool of water typically observed in the western Pacific Ocean. The warm pool also exhibits a seasonal cycle though more muted than in the cold tongue.
El Niño is associated with a weakening of the seasonal cycle and La Niña with an exaggeration of the seasonal cycle.
El Niño: The warm water (red) penetrating eastward in the Spring of 1987 (at the top of the plot) was the El Niño in 1986-1987. The warm water penetrating towards the east in the northern hemisphere spring of 1992 is the 1991-1992 El Niño. The El Niño events of 1997-1998 and 2015-2016 El Niño (at bottom of the plot) were unusually strong.
La Niña: The larger blue “scallops” in the eastern Pacific (on the right of the plot) are La Niña events,including the very strong La Niña in 1988-1989 (near the top of the plot).
Right panel – Sea Surface Temperature Deviations (Anomalies)
El Niño and La Niña years are easier to see in the deviations (anomalies) in the right hand panel. Water temperatures significantly warmer than the norm are shown in red, and water temperatures cooler than the norm are shown in blue.
El Niño, where the water is warmer than normal, is indicated by the red/yellow colors, and can be seen in 1986-1987, 1991-1992, 1993, 1994, 1997-1998 and 2015-2016. The rapid succession of El Niños beginning in the early 1990’s was unusual.
La Niña, where the water is cooler than normal, is indicated by blue colors. Notice the very cool water (blue) in 1988-1989, near the top of the plot, which was a very strong La Niña. Notice the cool water in 1995, 1998, 2007 and 2011, which were La Niña years. La Niña events occur after some (but not all) El Niños.
Notice that El Niño and La Niña events vary considerably in strength. For example, the La Niña in 1988 was stronger than the La Niñas in 1995 and 1998, and the 1997-1998 and 2015-2016 El Niños are unusually strong compared to those in 1991-1992, 1993, 1994 and 2010. Here is a list of list of El Niño and La Niña events (by year) from NOAA ESRL PSD, and another list of El Niño and La Niña years (by month) provided by the National Center for Environmental Prediction (NCEP).
La Niña Impact on the Global Climate
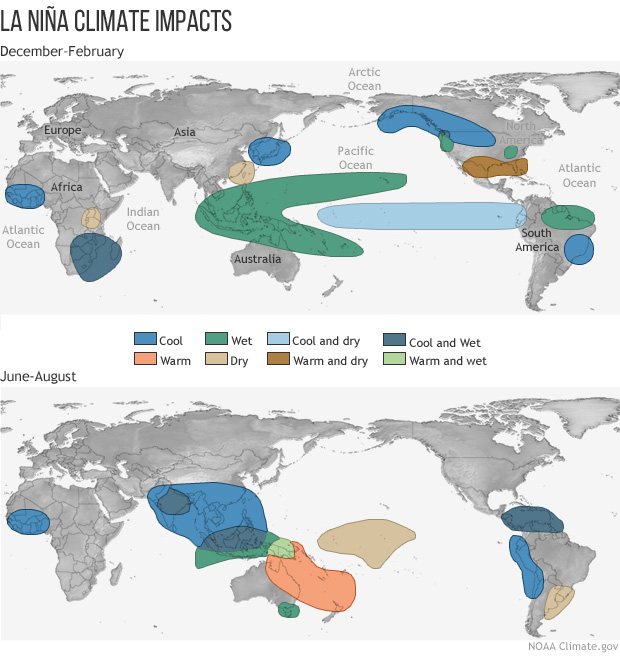
In the U.S., winter temperatures are warmer than normal in the Southeast, and cooler than normal in the Northwest. Global climate La Niña impacts tend to be opposite those of El Niño impacts. In the tropics, ocean temperature variations in La Niña tend to be opposite those of El Niño.
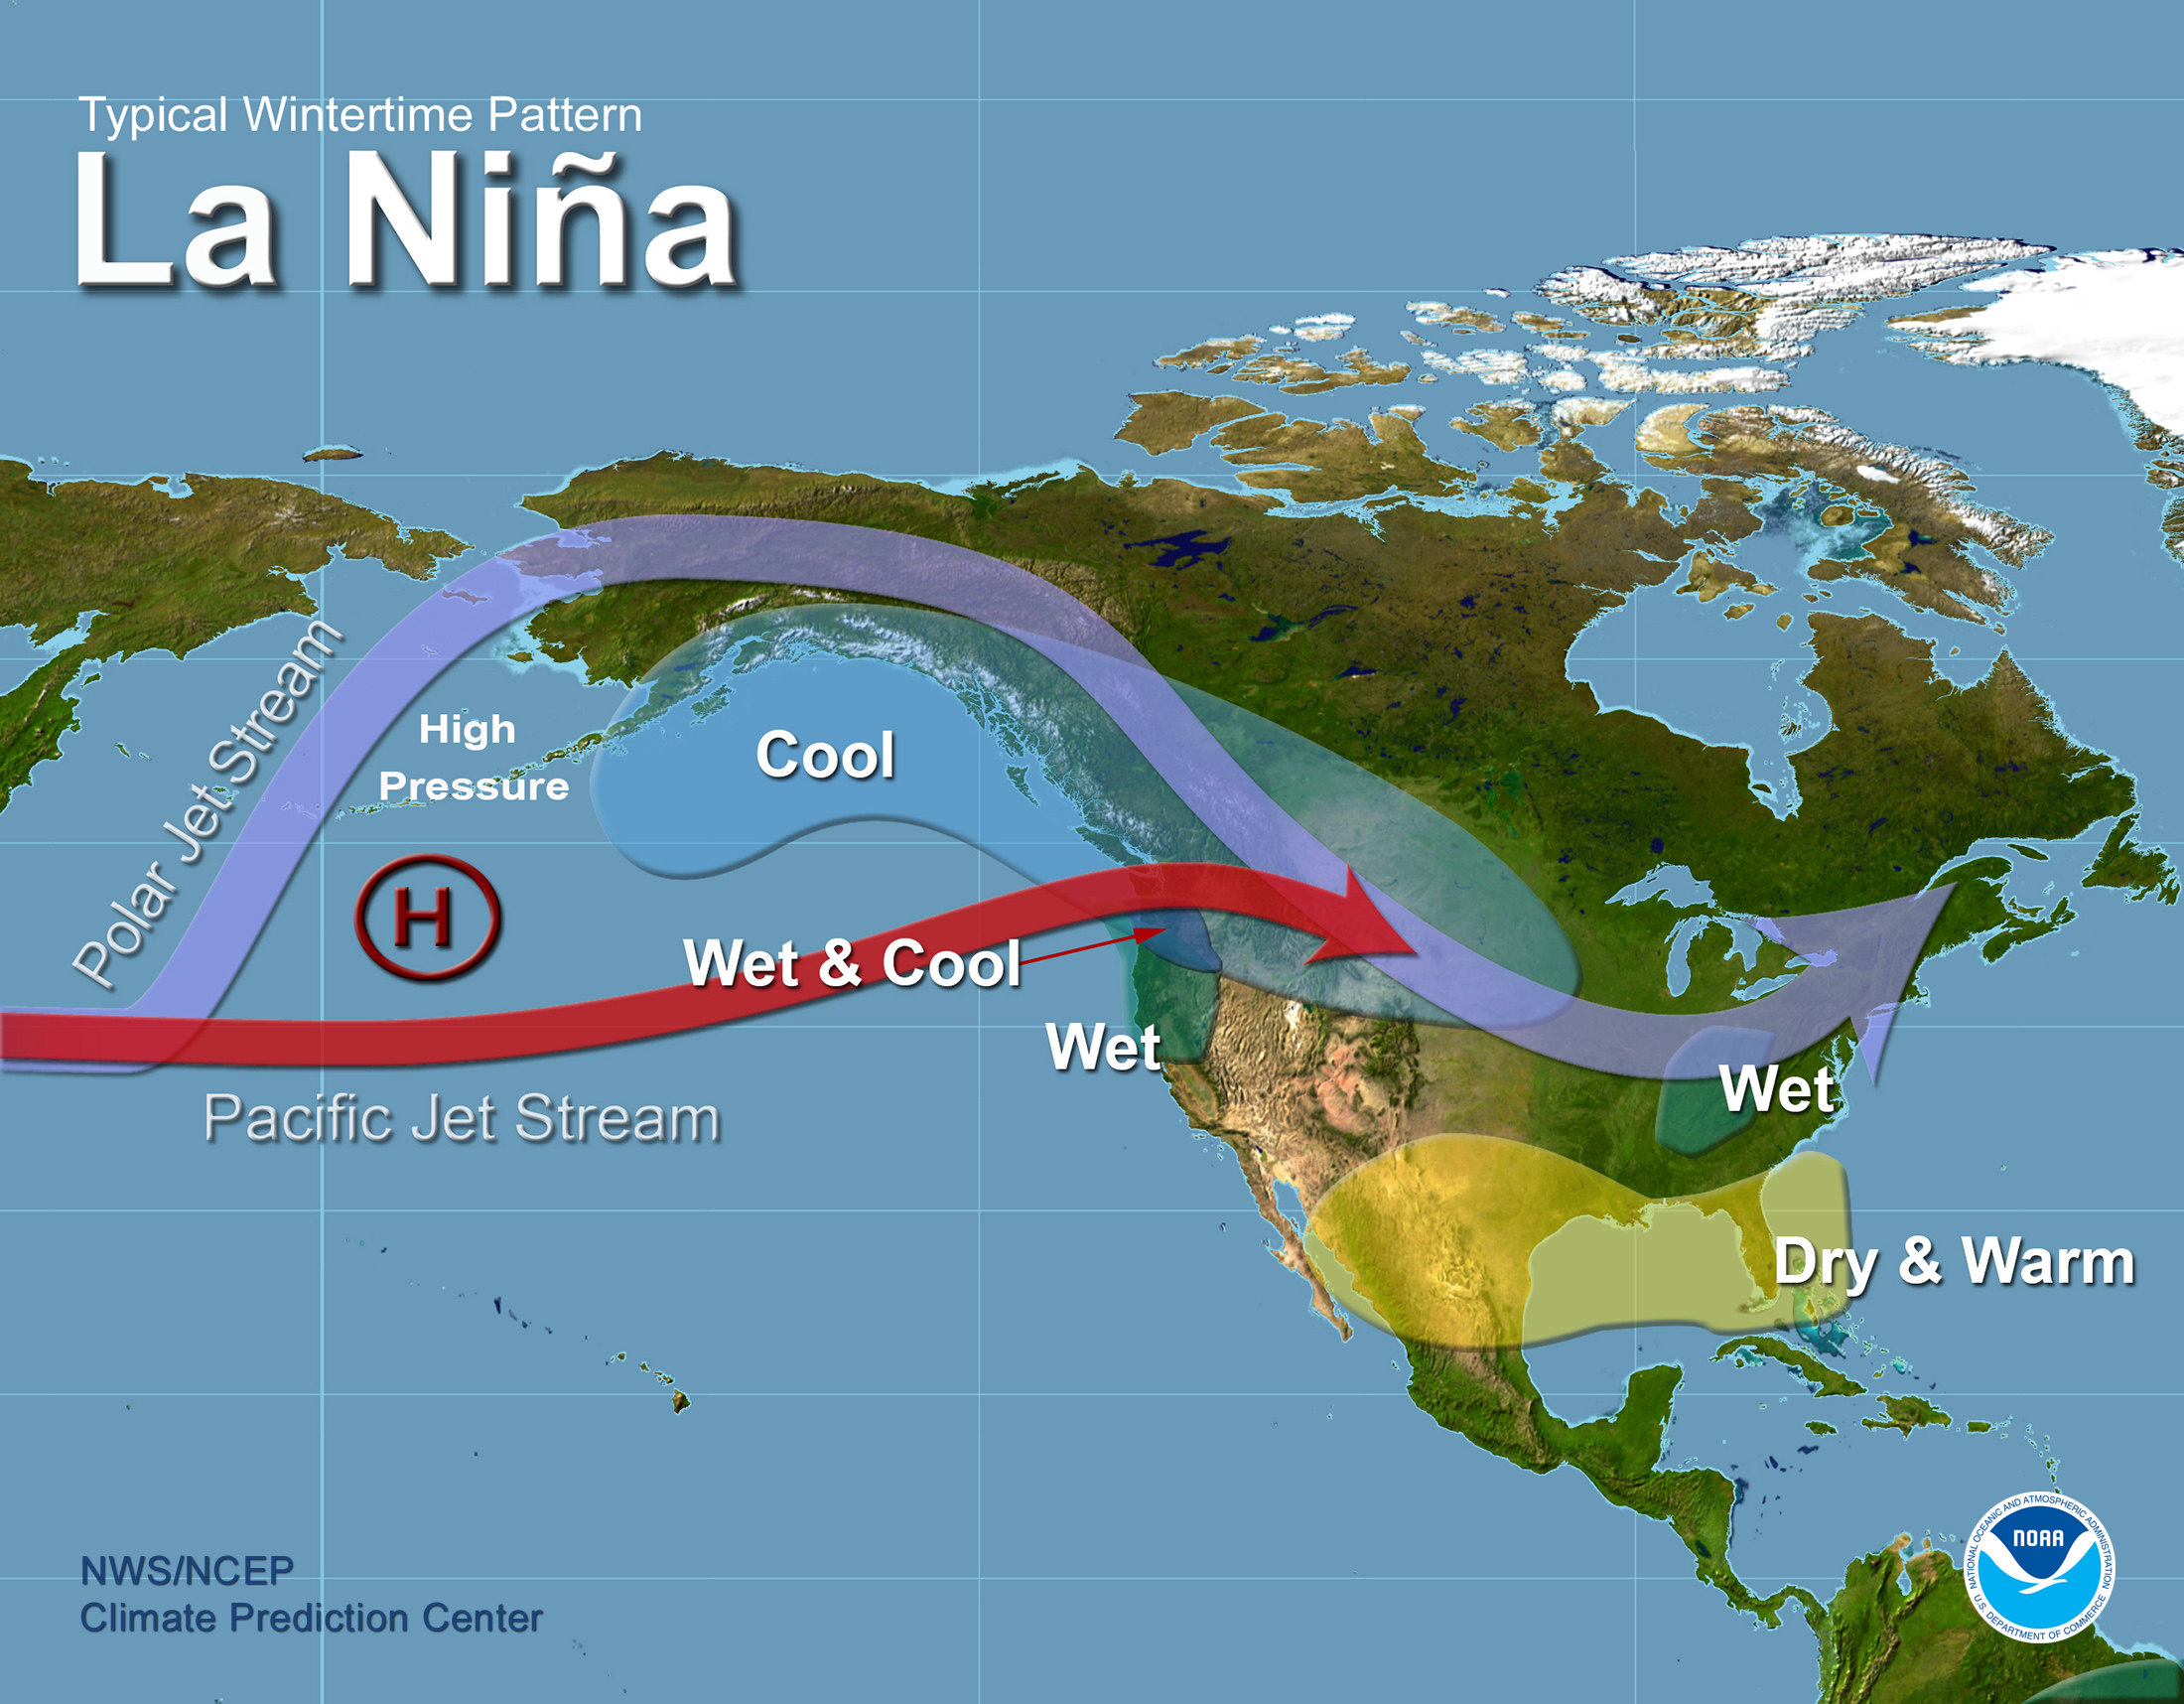
At higher latitudes, El Niño and La Niña are among a number of factors that influence climate. However, the impacts of El Niño and La Niña at these latitudes are most clearly seen in wintertime. In the continental US, during El Niño years, temperatures in the winter are warmer than normal in the North Central States, and cooler than normal in the Southeast and the Southwest. During a La Niña year, winter temperatures are warmer than normal in the Southeast and cooler than normal in the Northwest. See U.S. La Niña impacts from the National Weather Service.
The Origin of the Names, La Niña and El Niño
El Niño was originally recognized by fisherman off the coast of South America as the appearance of unusually warm water in the Pacific ocean, occurring near the beginning of the year. El Niño means The Little Boy or Christ child in Spanish. This name was used for the tendency of the phenomenon to arrive around Christmas. La Niña means The Little Girl. La Niña is also sometimes referred to as “an ENSO cold event”. More information on naming conventions can be found in this web page on definitions of the terms ENSO, Southern Oscillation Index, El Niño and La Niña. Also interesting is the Web page Where did the name El Niño come from?
Historical References
- McPhaden, M.J., 1999: Genesis and evolution of the 1997-98 El Niño. Science, 283, 950-954.
- McPhaden, M.J., S.E. Zebiak, and M.H. Glantz, 2006: ENSO as an integrating concept in Earth science. Science, 314, 1740-1745.
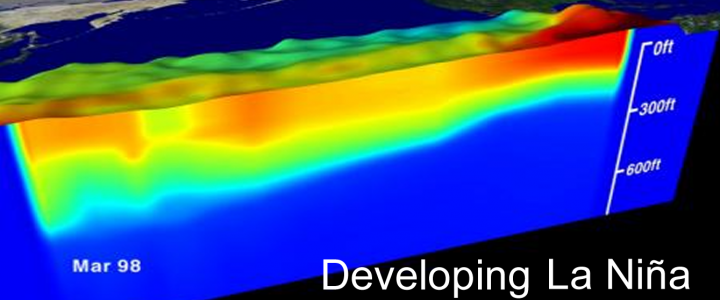
Banner graphic of TAO ocean temperatures from NASA. All other graphics provided by the TAO project office or by NOAA.
