
NOAA just updated us with some terrific data about how this strong El Nino compares to other strong El Ninos.
Just above and below are the only two maps you need to see.
- The above map shows us how this year’s precipitation compares to the other 6 strong El Ninos on record.
- The below map shows us how this year’s temperatures compares to the other 6 strong El Ninos on record.
Above Average Precipitation for a Strong El Nino Occurred In:
- Washington
- Oregon
- Extreme Northern California (Mt. Shasta)
- Nevada (Ruby Mountains)
- Select mountain locations in Colorado

If you need more detail, please read NOAA’s official El Nino update below:
Is El Niño the Marcia Brady of climate variability? No doubt that El Niño is the sexiest, most popular, and most studied aspect of climate variability. And we do continue to talk about El Niño events decades after they seem relevant, much like Marcia.
Now that the U.S. has just finished its warmest winter on record, we naturally ask ourselves just how influential the strong El Niño was. But how did other factors in the earth’s climate system contribute to the record-breaking season? How did Greg and Bobby and Cindy—or even Jan—influence the hit TV show from yesteryear? Was the success of the show solely due to Marcia, and was our warmest winter on record solely a result of El Niño?
In this Beyond the Data post, we take a closer look at the warmest winter on record and what role El Niño might have played.
No two El Niños are the same, but…
One of the most straightforward tools that climatologists have to examine how a particular climate pattern influences weather is comparing similar events from the past. It has been stated numerous times on this blog and others that no two El Niño events are the same, and that is definitely true for the current El Niño event. Still, we can use the past to identify big picture similarities that many El Niño events have in common.
To help us examine historical trends, we have identified six previous strong El Niño events in the 1950-present historical record: 1957-58, 1965-66, 1972-73, 1982-83, 1991-92, and 1997-98. According to NOAA’s Oceanic Niño Index (ONI), the current El Niño event is one of the strongest on record and of similar magnitude to the events in 1982-83 and 1997-98.
The table below shows the contiguous U.S. temperature during the past six strong El Niño winters (December-February) as well as this past winter. Winter seasons in the past tended to be close to or warmer than 1981-2010 average when a strong El Niño was present.
| 1957-58 | 1965-66 | 1972-72 | 1982-83 | 1991-92 | 1997-98 | 2015-16 | |
|---|---|---|---|---|---|---|---|
| 33.5°F | 31.2°F | 31.0°F | 35.3°F | 36.4°F | 35.9°F | 36.8°F | |
| rank now | 31st warmest | 32nd coldest | 61st coolest* | 13th warmest | 3rd warmest | 6th warmest | 1st warmest |
| 1981-2010 average | 33.5°F | average of 6 strong events | 33.9°F | ||||
As previously reported by NOAA, the winter (December-February) of 2015-16 was the warmest and 12th wettest on record for the contiguous United States. The average temperature was 36.8°F, 3.3°F above the 1981-2010 average, while the precipitation total was 8.05 inches, 1.25 inches above average. As you can see in the graph below, the record warm winter season for the contiguous U.S. was an unprecedented occurrence—with or without an El Niño present.
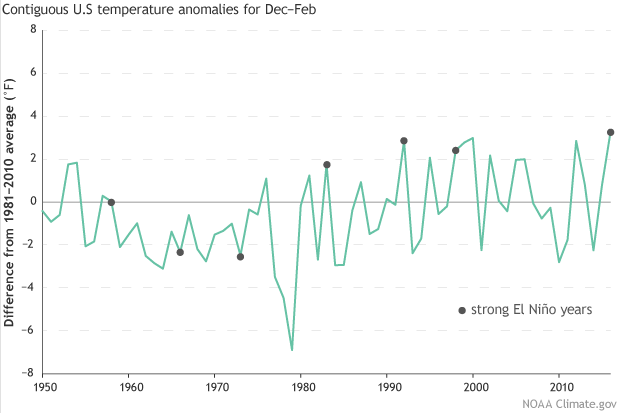
December-February temperature in the contiguous U.S. compared to the 1981-2010 average for each winter since 1950, with strong El Niño years marked with gray dots. Earlier El Niño winters were near or below-average, while the four most recent events saw warmer-than-average temperatures. NOAA Climate.gov graph, based on analysis by Jake Crouch, NCEI.
It is clear in the data that winters in the contiguous U.S. have warmed over time. Winters are warming at an average rate of 2.1°F per century since U.S. record keeping began in 1895, and 3.3°F per century since 1950 when our operational El Niño records begin. So, El Niño winters have gotten warmer through time due to climate change, despite no significant strengthening of El Niño events themselves. This warming trend means that the odds of having a record warm winter have increased, much like rolling loaded dice, and the El Niño potentially loaded the dice even slightly more.
A comparison to past El Niño winters
Temperature
During December-February 2015/2016 much of the contiguous U.S. was warmer than the 1981-2010 average, particularly areas across the North and east of the Rockies. Much of the warmth east of the Rockies occurred during the record-smashing heat wave during the last two weeks of December—an example of how a multi-week event can influence seasonal outcomes. Parts of the Mountain West saw temperatures that were near to below average.
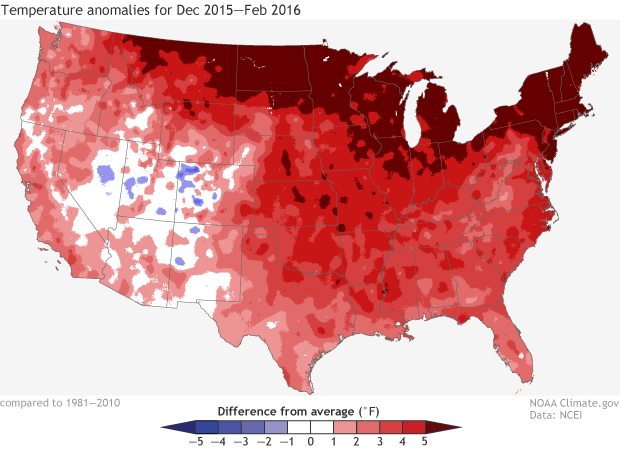
Winter temperatures (December 2015-February 2016) compared to the 1981-2010 average. It was the contiguous U.S.’ warmest winter on record. NOAA Climate.gov map based on analysis by Jake Crouch, NCEI.
Now compare this winter’s temperature pattern to an average temperature map of the previous six strong El Niño events (below). There isn’t much similarity across the southern half of the contiguous United States. However, there is a similar signal across the northern half of the country, with past strong El Niño events being warmer than average for the region.
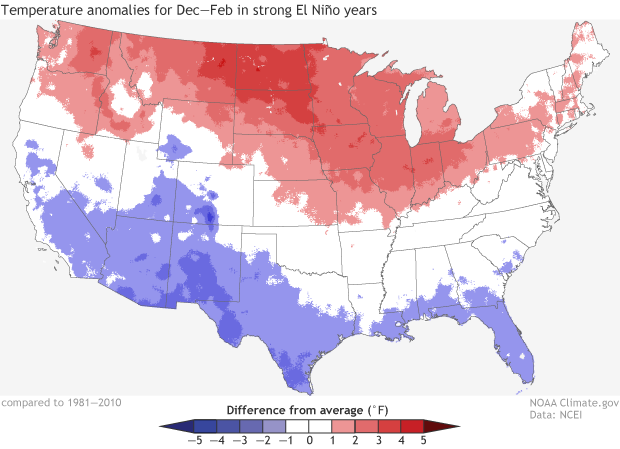
Winter temperatures (December-February) compared to the 1981-2010 average during the 6 strongest El Niño events since 1950 (not including the ongoing event). Based on these 6 events, strong El Niño winters are warmer than average across the northern U.S. and cooler than average across the southern U.S. NOAA Climate.gov map based on analysis by Jake Crouch, NCEI.
That northern-tier warmth stems from a strong, semi-permanent low pressure system called the Aleutian Low that sets up in the Gulf of Alaska during El Niño events. Downstream from the Aleutian low here in the contiguous U.S., cold air outbreaks from the Arctic tend to occur less frequently.
Precipitation
During December-February 2015-16 parts of the Northwest, Midwest, and along the East Coast, particularly South Florida, were wetter than average while parts of the Rocky Mountains, Southwest, Southern Plains, and Northern Plains were drier than average.
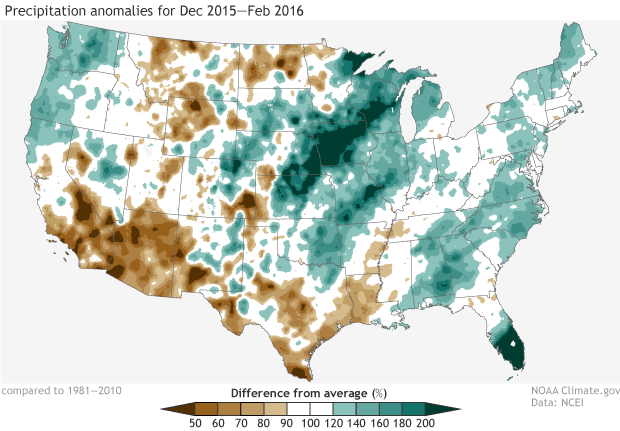
December 2015-February 2016 precipitation compared to the 1981-2010 average. It was wetter than average in the Pacific Northwest and part of the Gulf Coast, and much wetter than average in the Great Plains and southern Florida. NOAA Climate.gov map based on analysis by Jake Crouch, NCEI.
When we compare this winter’s precipitation pattern to the average precipitation map of the previous six strong El Niño events, there is not much similarity across the Southwest and Southern Plains. Part of the reason might be the small number of cases examined. With only six strong events observed over 67 years on top of a changing climate base state, we might not fully be able to represent what the signal of a strong El Niño actually looks like. One atypical event could have skewed the entire average.
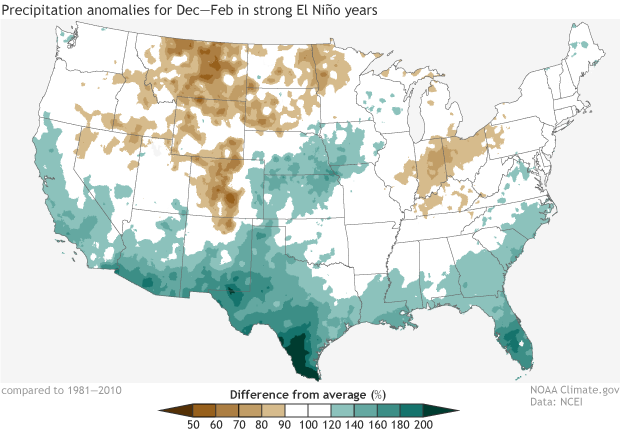
Winter precipitation (December-February) compared to the 1981-2010 average during the 6 strongest El Niño events since 1950 (not including the ongoing event). Based on these 6 events, strong El Niño winters are wetter than average across the southern U.S. and drier than average in the Northern Plains, the Northern and Southern Rockies, and the Ohio Valley. NOAA Climate.gov map based on analysis by Jake Crouch, NCEI.
Much of California was also drier than average during the winter of 2015/2016, which caused drought conditions to persist into mid-March. California has been dealing with drought going on five years, and many had high hopes that this El Niño would be the state’s savior because past El Niño events tended to be wet for the state. However, the precipitation received in California during the wet season through the end of February made only a minor dent in the multi-year precipitation deficits. However, early reports of heavy precipitation during March look promising!
Station data
How did major cities across the country fare during this winter in terms of average temperature, precipitation, and snowfall? Below are tables that compare what happened during the winter of 2015-16 to the winter seasons during past strong El Niño events. First up is temperature…
| 1957-58 | 1965-66 | 1972-73 | 1982-83 | 1991-92 | 1997-98 | 2015-16 | 1981-2010 average | average of 6 strong El Niño events |
|
|---|---|---|---|---|---|---|---|---|---|
| LAX | 60.0°F | 53.9°F | 56.6°F | 57.5°F | 59.3°F | 56.1°F | 59.1°F | 56.8°F | 57.2°F |
| San Fran (SFO) | 58.1°F | 47.1°F | 47.9°F | 50.1°F | 51.9°F | 52.1°F | 53.4°F | 51.3°F | 50.2°F |
| Seattle (SEATAC) | 44.9°F | 41.8°F | 40.2°F | 44.2°F | 45.0°F | 43.1°F | 44.7°F | 42.0°F | 43.2°F |
| Denver | 36.6°F | 30.6°F | 29.2°F | 33.1°F | 35.0°F | 31.5°F | 33.0°F | 31.2°F | 32.7°F |
| Chicago | 26.9°F | 27.5°F | 28.0°F | 30.9°F | 30.5°F | 33.2°F | 31.4°F | 26.2°F | 29.5°F |
| Houston | 53.7°F | 54.2°F | 50.2°F | 52.6°F | 55.2°F | 54.1°F | 57.0°F | 55.7°F | 53.3°F |
| Miami | 62.0°F | 68.0°F | 68.8°F | 69.0°F | 70.0°F | 69.4°F | 71.0°F | 69.6°F | 67.9°F |
| Washington (Reagan) | 35.7°F | 36.7°F | 39.4°F | 40.8°F | 40.6°F | 42.5°F | 42.0°F | 38.2°F | 39.3°F |
| NYC (Central Park) | 33.2°F | 35.9°F | 35.5°F | 37.9°F | 37.2°F | 39.6°F | 41.0°F | 35.1°F | 36.6°F |
| Phoenix | 54.5°F | 50.2°F | 53.6°F | 56.1°F | 58.6°F | 54.5°F | 58.5°F | 57.2°F | 54.6°F |
And here is total winter precipitation…
| 1957-58 | 1965-66 | 1972-73 | 1982-83 | 1991-92 | 1997-98 | 2015-16 | 1981-2010 average | average of 6 strong El Niño events |
|
|---|---|---|---|---|---|---|---|---|---|
| LAX | 9.85 | 5.49 | 9.91 | 11.55 | 9.17 | 21.43 | 4.75 | 8.01 | 11.23 |
| San Fran (SFO) | 18.35 | 10.90 | 17.54 | 17.46 | 21.98 | 25.71 | 9.80 | 12.28 | 18.66 |
| Seattle (SEATAC) | 19.60 | 14.84 | 15.16 | 18.50 | 14.22 | 13.09 | 24.63 | 14.42 | 15.90 |
| Denver | 1.79 | 2.11 | 2.17 | 2.56 | 1.47 | 0.78 | 1.69 | 1.53 | 1.81 |
| Chicago | 3.40 | 7.32 | 7.52 | 11.28 | 3.97 | 5.87 | 6.94 | 5.77 | 6.56 |
| Houston | 9.36 | 16.11 | 10.60 | 10.88 | 23.03 | 15.62 | 9.32 | 11.11 | 14.27 |
| Miami | 10.05 | 11.15 | 9.80 | 14.61 | 3.47 | 12.93 | 20.24 | 5.91 | 10.34 |
| Washington (Reagan) | 12.27 | 7.99 | 9.49 | 6.52 | 10.08 | 12.40 | 11.31 | 8.48 | 9.79 |
| NYC (Central Park) | 12.03 | 9.31 | 15.17 | 9.70 | 7.81 | 15.28 | 13.53 | 10.74 | 11.55 |
| Phoenix | 1.45 | 4.49 | 3.05 | 3.51 | 4.15 | 4.11 | 1.52 | 2.71 | 3.46 |
Finally, here is snowfall during strong El Niño winters…
| 1957-58 | 1965-66 | 1972-73 | 1982-83 | 1991-92 | 1997-98 | 2015-16 | 1981-2010 average | average of 6 strong El Niño events |
|
|---|---|---|---|---|---|---|---|---|---|
| LAX | 0 | 0 | 0 | 0 | 0 | 0 | 0 | 0 | 0 |
| San Fran (SFO) | 0 | 0 | 0 | 0 | 0 | 0 | 0 | 0 | 0 |
| Seattle | T | 17.4 | 8.3 | T | 0 | missing* | T | 4.8 | 5.14 |
| Denver | 21.7 | 23.8 | 24.5 | 29.2 | 26.5 | missing* | 27.5 | 21.2 | 25.14 |
| Chicago | 16.2 | 20.9 | 20.0 | 16.0 | 14.5 | 7.1 | 16.3 | 28.4 | 15.8 |
| Houston | missing* | missing* | 4.8 | 0 | 0 | 0 | 0 | 0 | 1.2 |
| Miami | 0 | 0 | 0 | 0 | 0 | 0 | 0 | 0 | 0 |
| Washington (Reagan) | 29.5 | 28.4 | 0.1 | 27.6 | 6.6 | 0.1 | 21.9 | 12.7 | 15.4 |
| NYC (Central Park) | 28.6 | 21.4 | 2.6 | 26.4 | 3.2 | 0.5 | 31.2 | 20.6 | 13.8 |
| Phoenix | 0 | 0 | 0 | 0 | 0 | 0 | 0 | 0 | 0 |
Episode recap
Was El Niño solely responsible for the record warm winter for the contiguous United States? No, but for some areas, like the northern U.S., the El Niño likely played a role. We know that other factors including climate patterns in the north Atlantic, Pacific, and tropics also influenced our weather during winter. Longer-term climate change was also a player, similar to Alice, the Brady family’s housekeeper—an ever-present force influencing outcomes to varying degrees.
But exactly how much of the record warm winter was due to the El Niño, and how much was due to other climate patterns, including climate change? That is a question yet to be answered, but the answer—like most climate extremes—is likely some version of “all of the above.”
When trying to determine how a strong El Niño impacted winter seasonal outcomes across the contiguous U.S., we might be easily lulled into false expectations. Just like Jan’s complaint that no one could keep their eyes off Marcia, we often can’t keep our eyes off El Niño. Yes, El Niño events have well documented historical impacts in the U.S., but there are always other players involved, just like other members of the Brady family influenced an episode’s outcome.
Our climate is changing and our assumptions of how El Niño will impact the U.S. might need to be revisited. But we also need to understand that there is variability even within well-understood climate patterns like El Niño, and we must keep an open mind when it comes to the impacts of less exciting climate patterns.
Was Marcia ever really going to be a teen model, and was this El Niño ever going to manifest itself in the way we expected? Probably not. To truly understand the beauty of the Brady family, we must look beyond the obvious choice.