The story ‘Smoke Across North America’ first appeared on NASA Earth Observatory and was written by Adam Voiland.
While plumes of wildfire smoke from western North America have passed over the northeastern U.S. and Canada multiple times each summer in recent years, they often go unnoticed. That is because smoke that spreads far from its source typically moves at a fairly high altitude—between 5 and 10 kilometers—as winds blow it eastward.
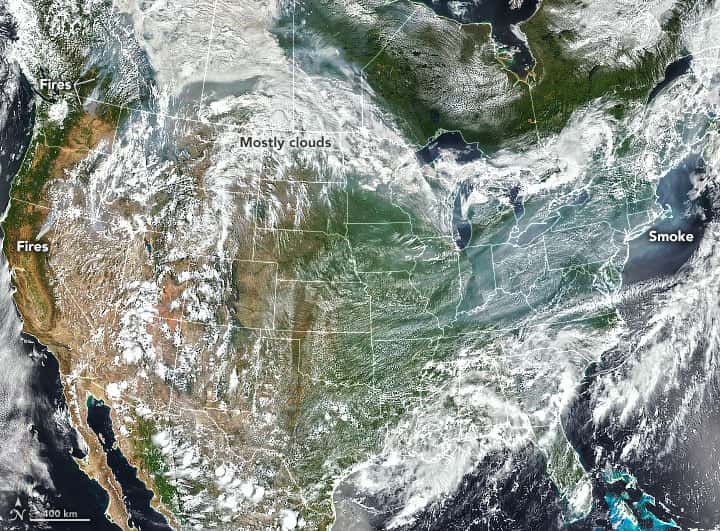
The situation has been quite different this week, as attention-grabbing smoke poured into the eastern U.S. on July 20-21, 2021. Data from NASA’s Micro-Pulse Lidar Network (MPLNET) and Aerosol Robotic Network (AERONET) indicated that a significant amount of smoke was hovering between the land surface and 2 kilometers (1 mile) altitude. Haze darkened skies and reddened sunsets unleashed a rash of code red and orange air quality warnings and even left the scent of smoke in the air in some areas.

Of the large cities in the northeast, Philadelphia and New York City had some of the haziest skies. The Visible Infrared Imaging Radiometer Suite (VIIRS) on NOAA-20 captured the natural-color image of smoke over the northeast shown above on July 20.
In New York City, levels of fine particulate pollution rose above 170 on the air quality index, a level considered harmful even for healthy people. “That’s a magnitude of particle pollution that New York City hasn’t seen in more than a decade,” said Ryan Stauffer, an atmospheric scientist based at NASA’s Goddard Space Flight Center. The haze grew so thick at times that it even partially obscured the city’s iconic skyline.
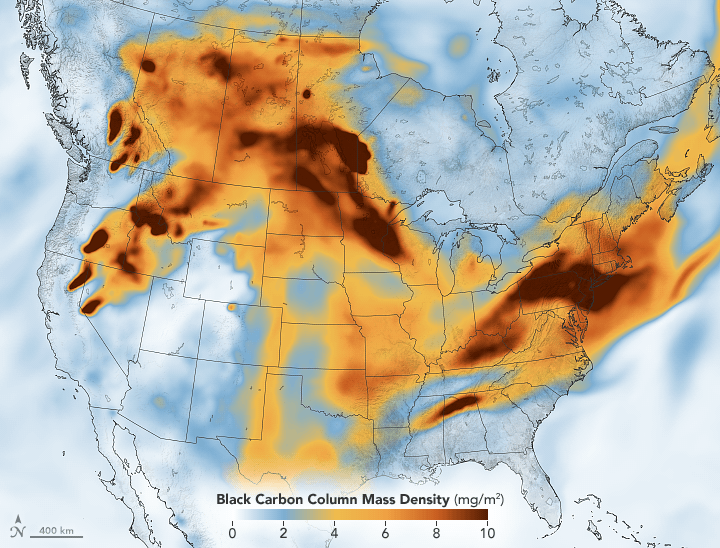
While several forest fires are raging across North America, most of the smoke that found its way to the eastern U.S. likely originated from a cluster of fires near the border of the Canadian provinces of Manitoba and Ontario, just north of Minnesota. Fires burning farther to the west in British Columbia and the Pacific Northwest of the United States may have contributed a small amount of smoke as well.
This map at the top of the page shows the concentration of black carbon particulates—commonly called soot—over North America on July 21, 2021. It is just one of several types of particles and gases found within wildfire smoke. The black carbon data come from the GEOS forward processing (GEOS-FP) model, which assimilates data from satellite, aircraft, and ground-based observing systems. To simulate black carbon, modelers include satellite observations of aerosols and fires. GEOS-FP also ingests meteorological data like air temperature, moisture, and winds to simulate the plume’s behavior.
NASA Earth Observatory images by Joshua Stevens, using GEOS-5 data from the Global Modeling and Assimilation Office at NASA GSFC and VIIRS data from NASA EOSDIS LANCE, GIBS/Worldview, and the Joint Polar Satellite System (JPSS).