
This year’s El Nino is now officially considered a strong El Nino (1.5ºC above average sea surface temps). So far, this is the third strongest El Nino on record behind 1987 and 1997.
“The July-September 3-month average sea surface temperature (the ONI) was 1.5°C above normal, third in line behind July-September 1987 (1.6°C) and 1997 (1.7°C).” – NOAA, yesterday
WHAT DOES IT MEAN FOR PRECIPITATION IN NORTH AMERICA?
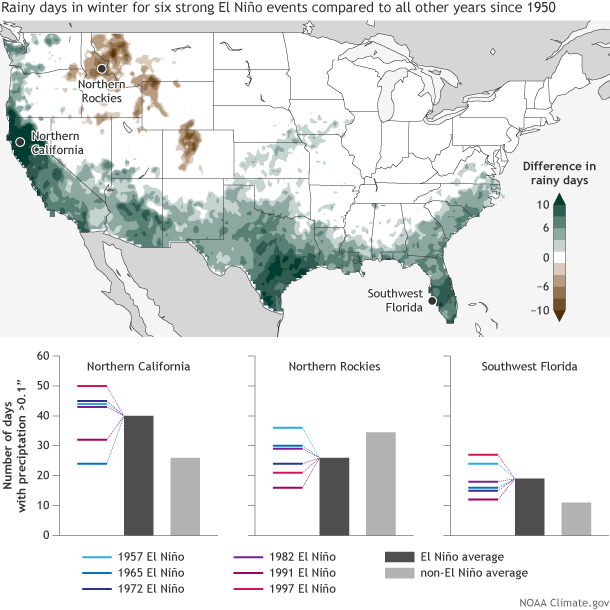
So far, NOAA is saying that this should be an above average precipitation winter for California. They’re also saying that it should be a below average precipitation winter for the Northern Rockies. See below:

- (top) Number of days with heavy rain or snow (one-day total greater than 1 inch) in winter (December-February) during six strong El Niños (1957-58, 1965-66, 1972-73, 1982-83, 1991-92, and 1997-98) compared to the average during non-El Niño winters since 1950. (bottom) Details for three locations, showing total number of days with heavy rain or snow during six individual strong El Niño winters (colored lines), the average number during strong El Niños (dark gray bar), and the average during non-El Niño winters (light gray bar). Image by FIona Martin, based on precipitation data from CPC Unified Rain Gauge Data.
HOW DOES THIS YEAR’S EL NINO COMPARE TO PREVIOUS EL NINO’S:
This graph shows us exactly where the current El Nino is compared to other El Nino’s of the past. So far, it’s the 3rd strongest El Nino on record.

WHAT DOES THIS ALL MEAN FOR CALIFORNIA:
According to averages, California should see above average precipitation. The only problem is, we can’t be sure if its going to be rain or snow in the high mountains. El Nino’s typically bring warmer stroms to California.
The below graph shows us the precipitation average of all the 6 recorded strong El Nino’s in northern California being above the overall average. The 6 dots below represent the 6 strong El Nino’s precipitation totals in NorCal.
