
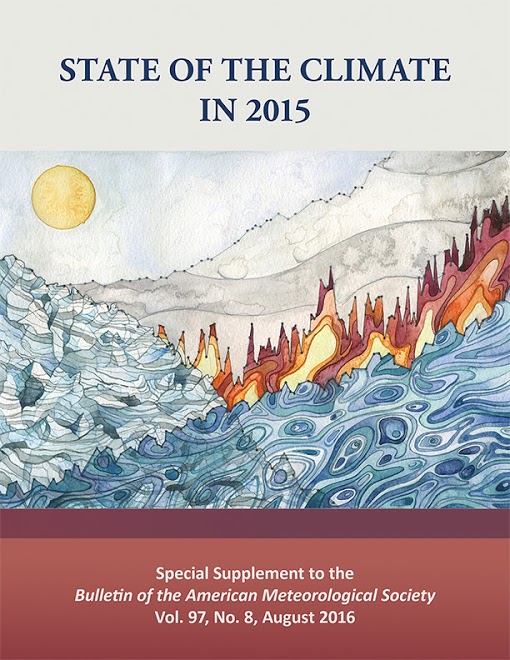
What is the State of the Climate in 2015 report?
“This yearly “check-up” for the planet, led by NOAA’s National Centers for Environmental Information, is based on contributions from more than 450 scientists from 62 countries around the world. It published as a special supplement to the Bulletin of the American Meteorological Society.” – NOAA
See full report here:
State of the Climate in 2015
HIGHLIGHTS FROM THE STATE OF THE CLIMATE IN 2015 REPORT:
- Greenhouse gases were the highest on record.
- Global surface temperature was the highest on record.
- Sea surface temperature was the highest on record.
- Global sea level rose to a new record high in 2015.
- Tropical cyclones were well above average, overall.
- The Arctic continued to warm; sea ice extent remained low.
- During its growth season, the Arctic had its smallest annual maximum sea ice extent on record.
- 2015 was a tough year for vegetation, with a near-record area of global land surfaces in some state of drought.
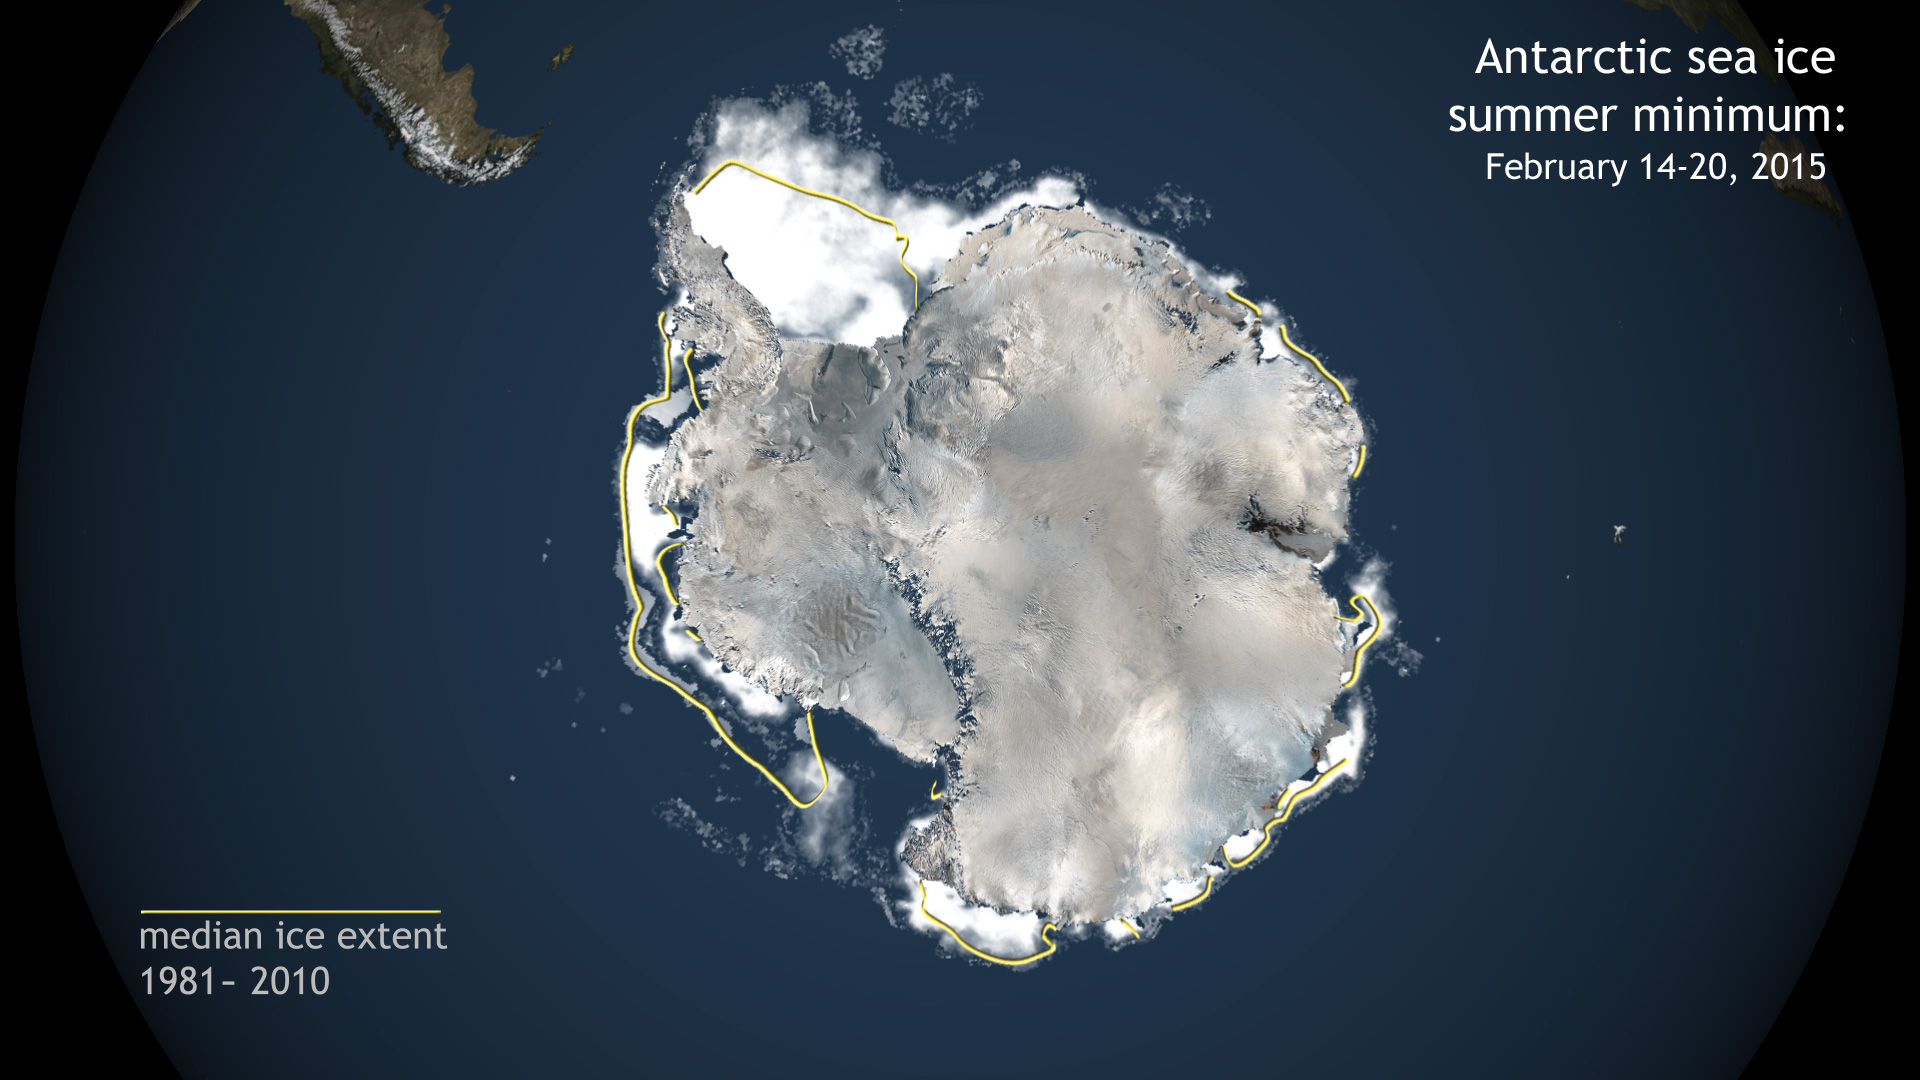
- During its growth season, which peaked in February, the Antarctic had its 16th largest annual maximum extent.

International Report Confirms Earth is Hot and Getting Hotter
2015 topped 2014 as warmest year on record with help from El Nino
August 2, 2016
by NOAA
An annual State of the Climate report has confirmed that 2015 surpassed 2014 as the warmest year on record since at least the mid-to-late 19th century.
Last year’s record heat resulted from a combination of long-term global warming and one of the strongest El Niño experienced since at least 1950, according to the more than 450 scientists that contributed to the report. They found that most indicators of climate change continued to reflect trends consistent with a global warming.
Notable findings from the report include:
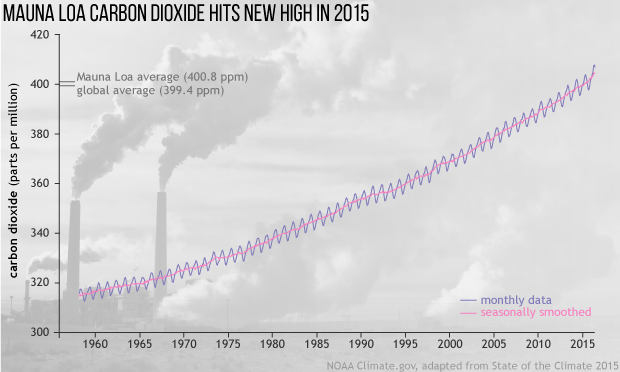
- Greenhouse gases were the highest on record. Major greenhouse gas concentrations, including carbon dioxide (CO2), methane and nitrous oxide, rose to new record high values during 2015. The 2015 average global CO2 concentration was 399.4 parts per million (ppm), an increase of 2.2 ppm compared with 2014.
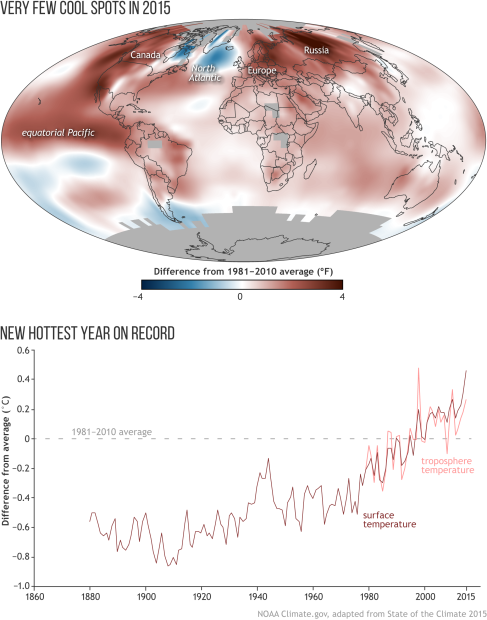
- Global surface temperature was the highest on record. Aided by the strong El Niño, the 2015 annual global surface temperature was 0.76–0.83 degrees F (0.42°–0.46°C) above the 1981–2010 average, surpassing the previous record set in 2014.
- In 2015, glaciers across the globe, on average, continued to shrink for the 36th consecutive year. Cumulative mass loss since 1980 is 18.8 meters, the equivalent of cutting a 20.5 meter [67-foot] thick slice of the top of the average glacier.
![In 2015, glaciers across the globe, on average, continued to shrink for the 36th consecutive year. Cumulative mass loss since 1980 is 18.8 meters, the equivalent of cutting a 20.5 meter [67-foot] thick slice of the top of the average glacier.](http://snowbrains.com/wp-content/uploads/2016/08/reference_glacier_massloss_1980-2015_lrg-620x311.png)
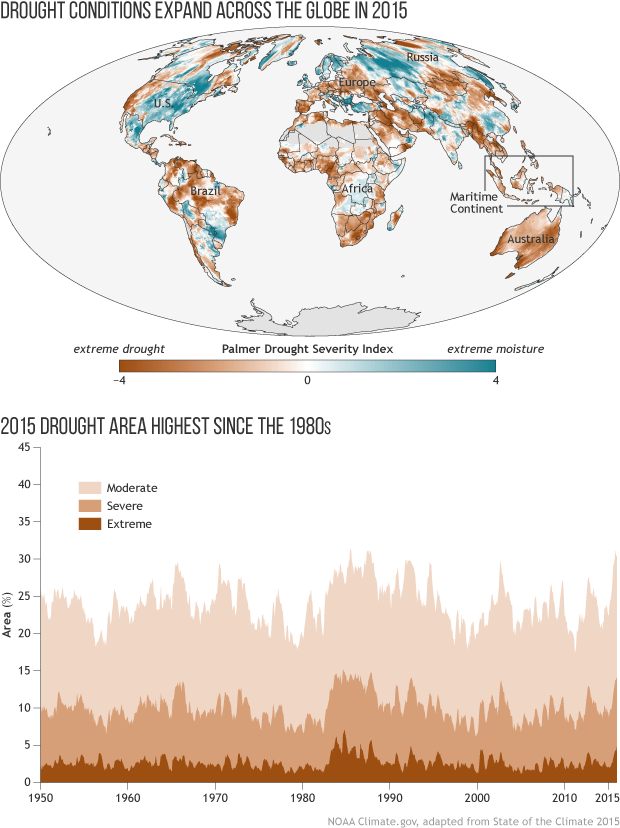
- 2015 was a tough year for vegetation, with a near-record area of global land surfaces in some state of drought. The area in severe drought increased from 8% at the end of 2014 to 14% by the end of 2015.
- Sea surface temperature was the highest on record. The globally averaged sea surface temperature was 0.59–0.70 degrees F (0.33°–0.39°C) above average, breaking the previous mark set in 2014.
- Global upper ocean heat content highest on record. Upper ocean heat content exceeded the record set in 2014, reflecting the continuing accumulation of heat in the ocean’s top layers.
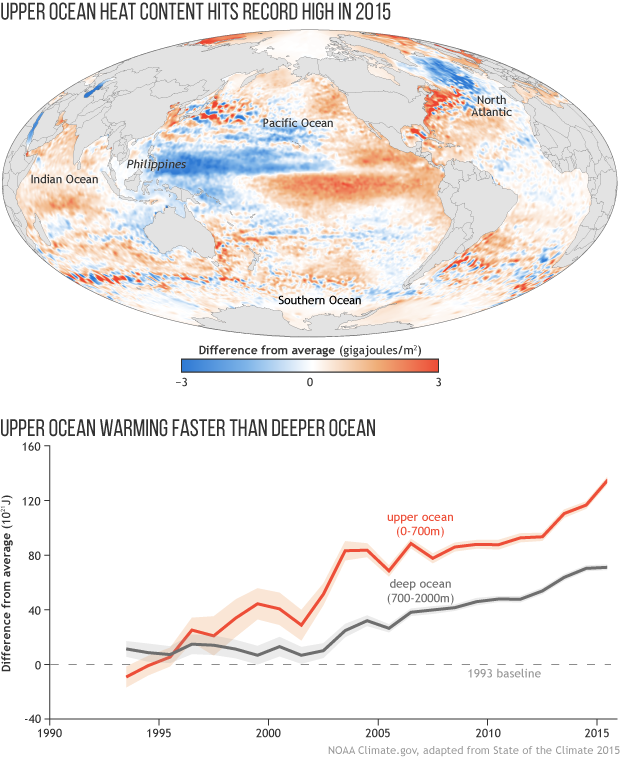
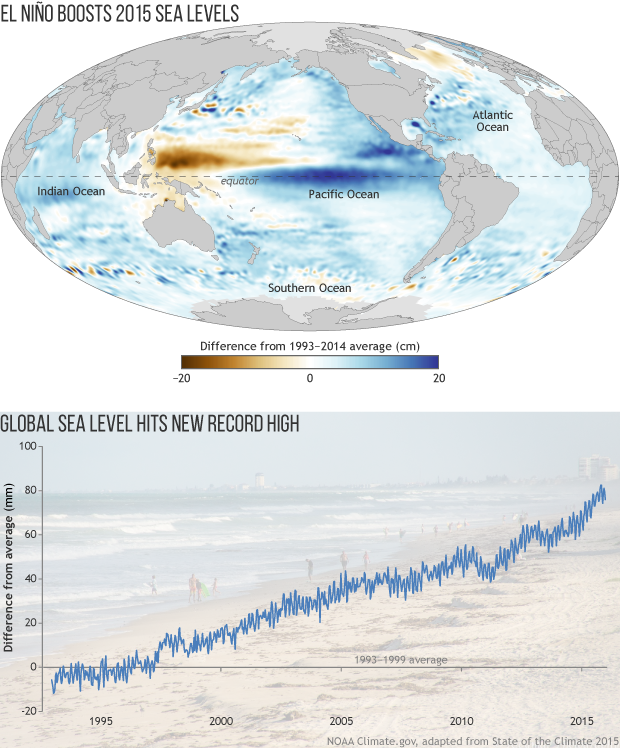
- Global sea level rose to a new record high in 2015. It measured about 2.75 inches (70 mm) higher than that observed in 1993, when satellite record-keeping for global sea level rise began.
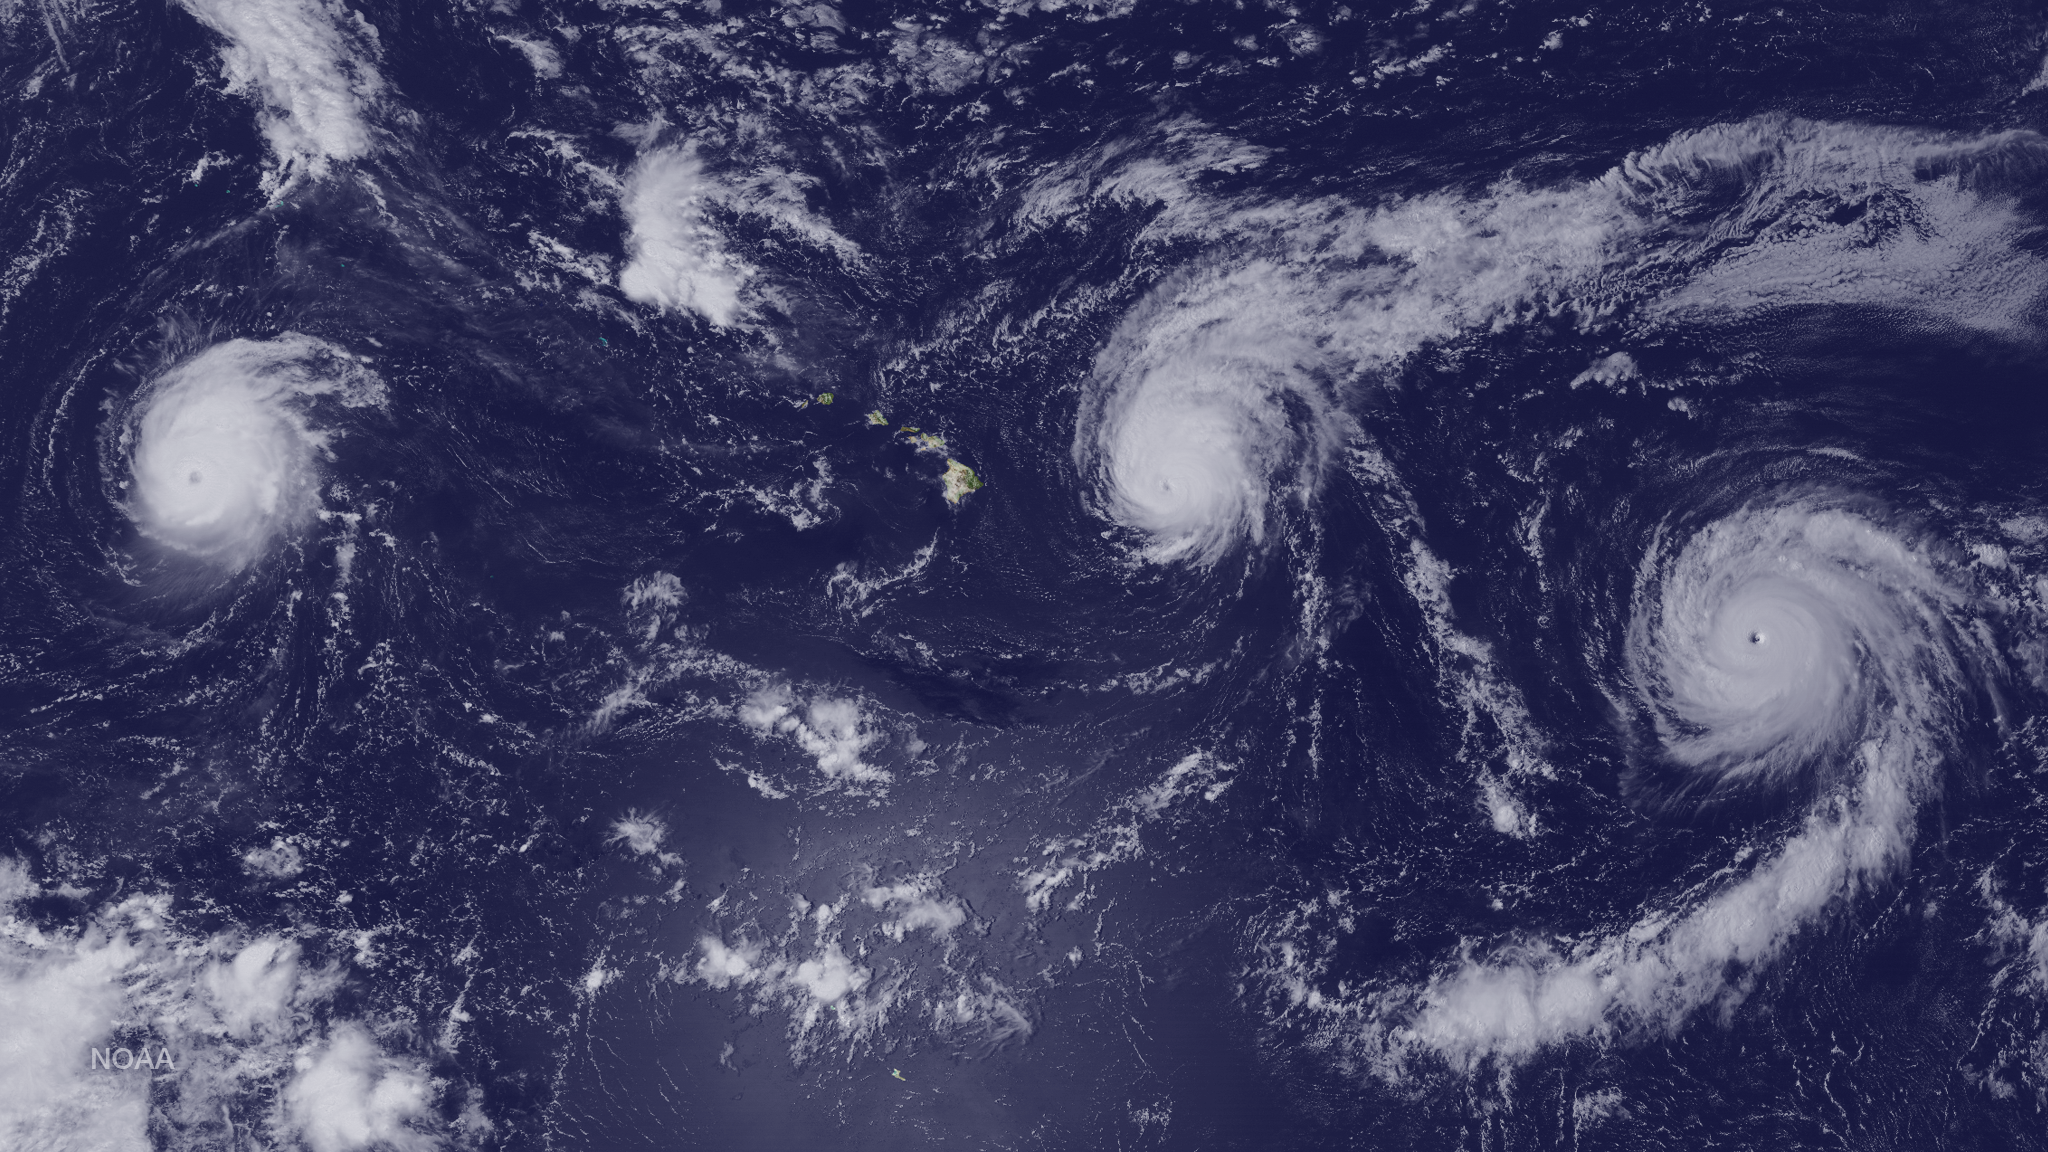
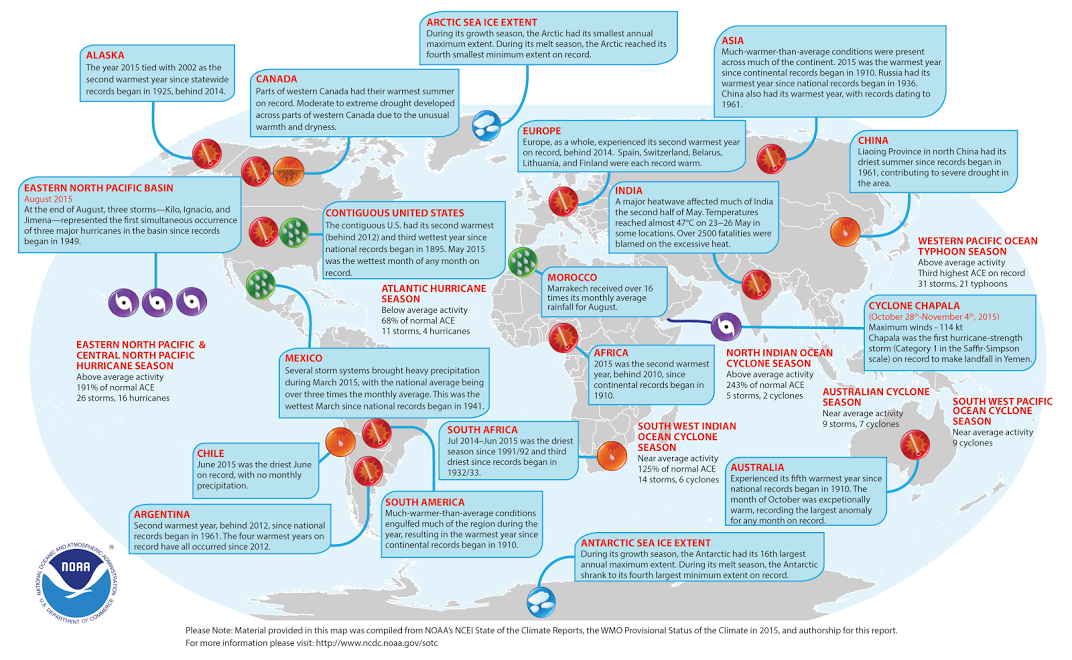
- Tropical cyclones were well above average, overall. There were 101 tropical cyclones total across all ocean basins in 2015, well above the 1981-2010 average of 82 storms. The eastern/central Pacific had 26 named storms, the most since 1992. The North Atlantic, in contrast, had fewer storms than most years during the last two decades.
- During its growth season, the Arctic had its smallest annual maximum sea ice extent on record. During its melt season, the Arctic reached its fourth smallest minimum extent on record.
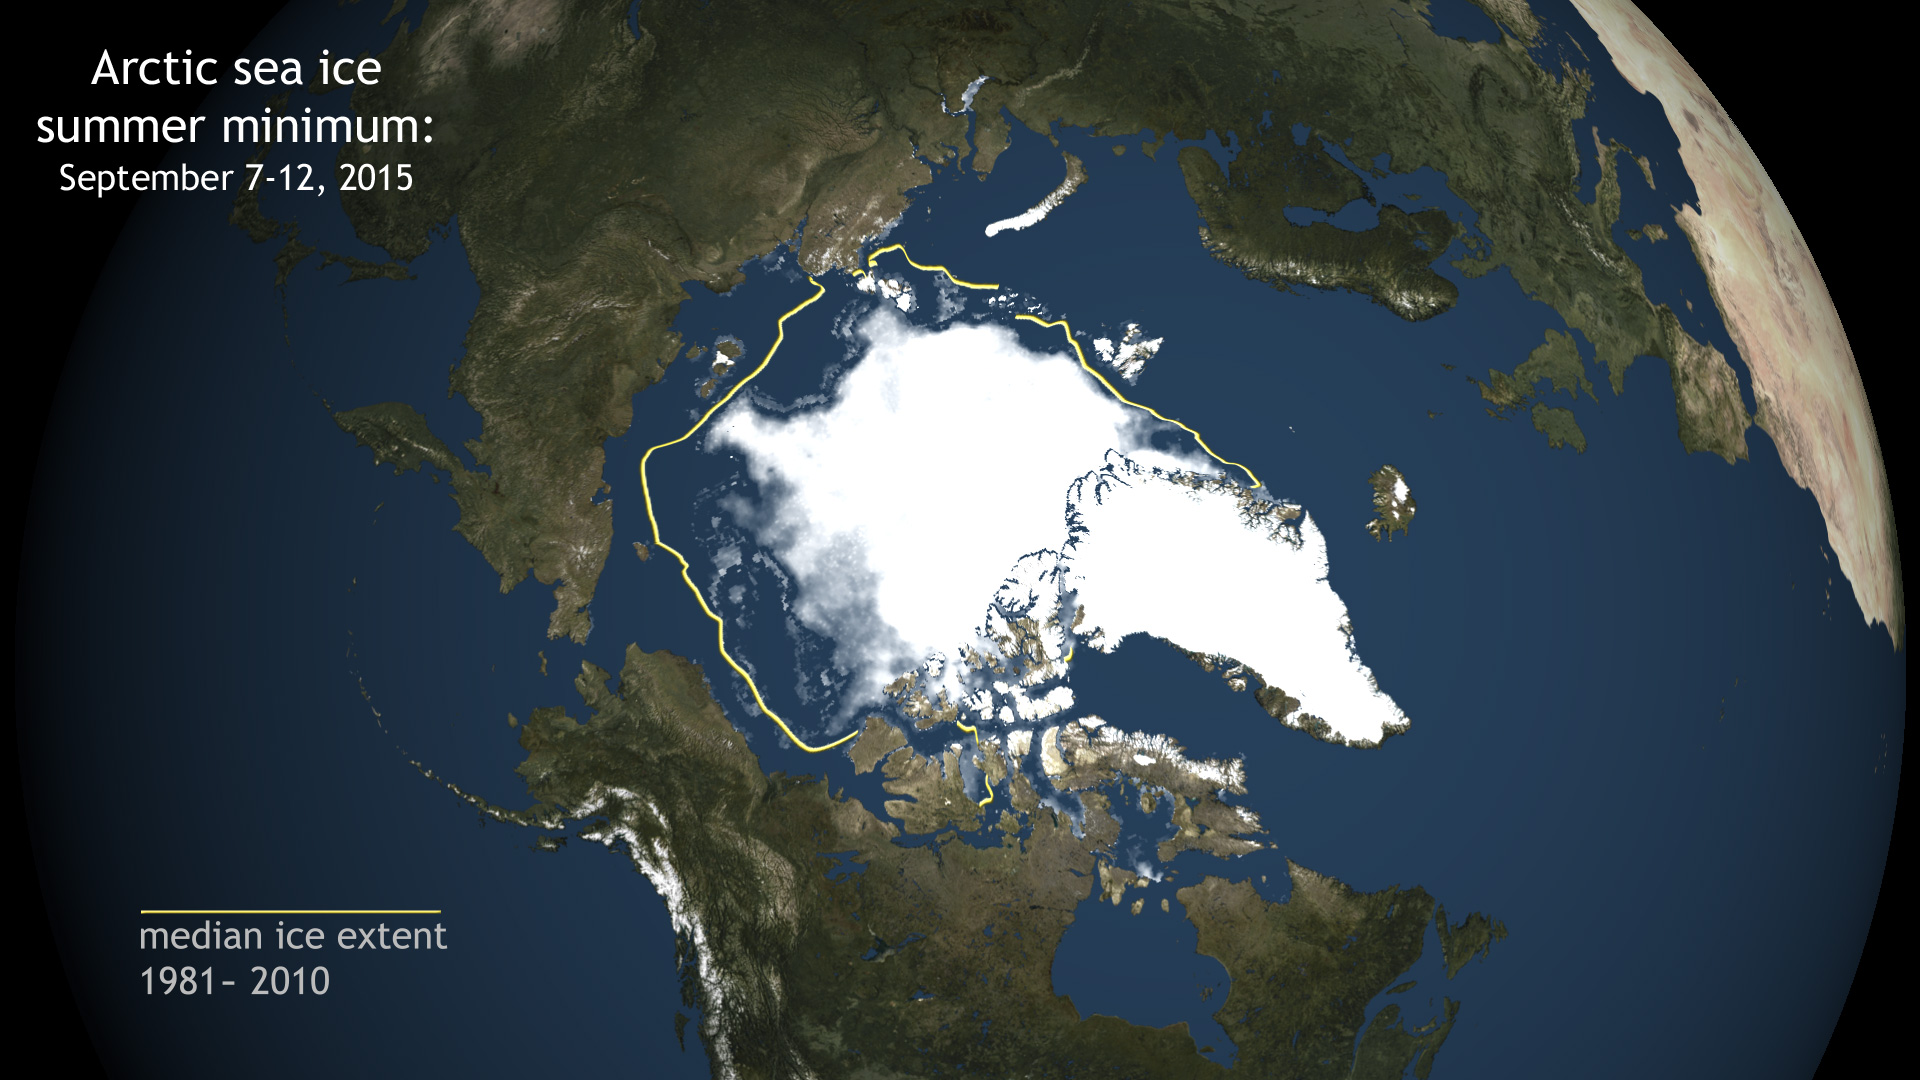
- The Arctic continued to warm; sea ice extent remained low. The Arctic land surface temperature in 2015 was 2.2 degrees F (1.2°C) above the 1981-2010 average, tying 2007 and 2011 as the highest on record. The maximum Arctic sea ice extent reached in February 2015 was the smallest in the 37-year satellite record, while the minimum sea ice extent that September was the fourth lowest on record.
- During its growth season, which peaked in February, the Antarctic had its 16th largest annual maximum extent. During its melt season, the Antarctic shrank to its fourth largest minimum extent on record.
About the State of the Climate 2015 Report
This yearly “check-up” for the planet, led by NOAA’s National Centers for Environmental Information, is based on contributions from more than 450 scientists from 62 countries around the world. It published as a special supplement to the Bulletin of the American Meteorological Society.
Thanks for posting this.