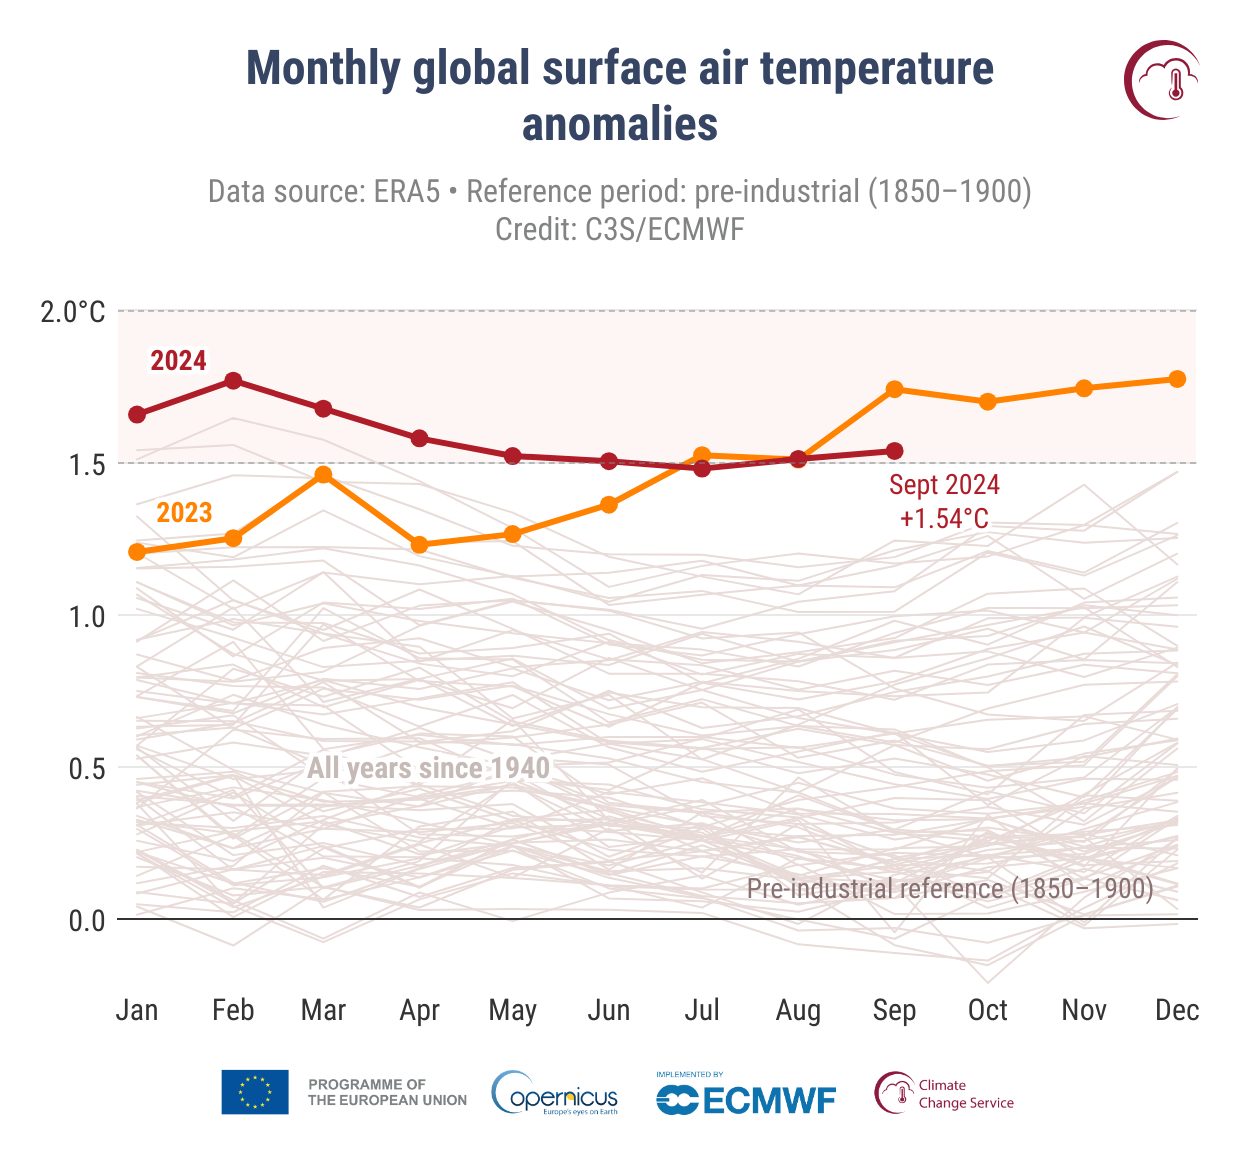
Monthly global surface air temperature anomalies (°C) relative to 1850–1900 from January 1940 to September 2024, plotted as time series for each year. 2024 is shown with a thick red line, 2023 with a thick orange line, and all other years with thin grey lines. | Credit: C3S/ECMWF
According to the Copernicus Climate Change Service (C3S), the climate change service of the the European Space Agency Copernicus, September 2024 was the second hottest September on record. Globally, ERA5 surface air temperatures were 16.17°C, which is 0.73°C above the 1991-2020 average for September. This puts September 2024 1.54°C above the pre-industrial level. It also marked the 14th month in a 15-month period for which the global-average surface air temperature exceeded 1.5°C above pre-industrial levels.
The global-average temperature for the past 12 months (October 2023 – September 2024) is the second highest on record for any 12-month period, at 0.74°C above the 1991-2020 average, or an estimated 1.62°C above the 1850-1900 pre-industrial average.
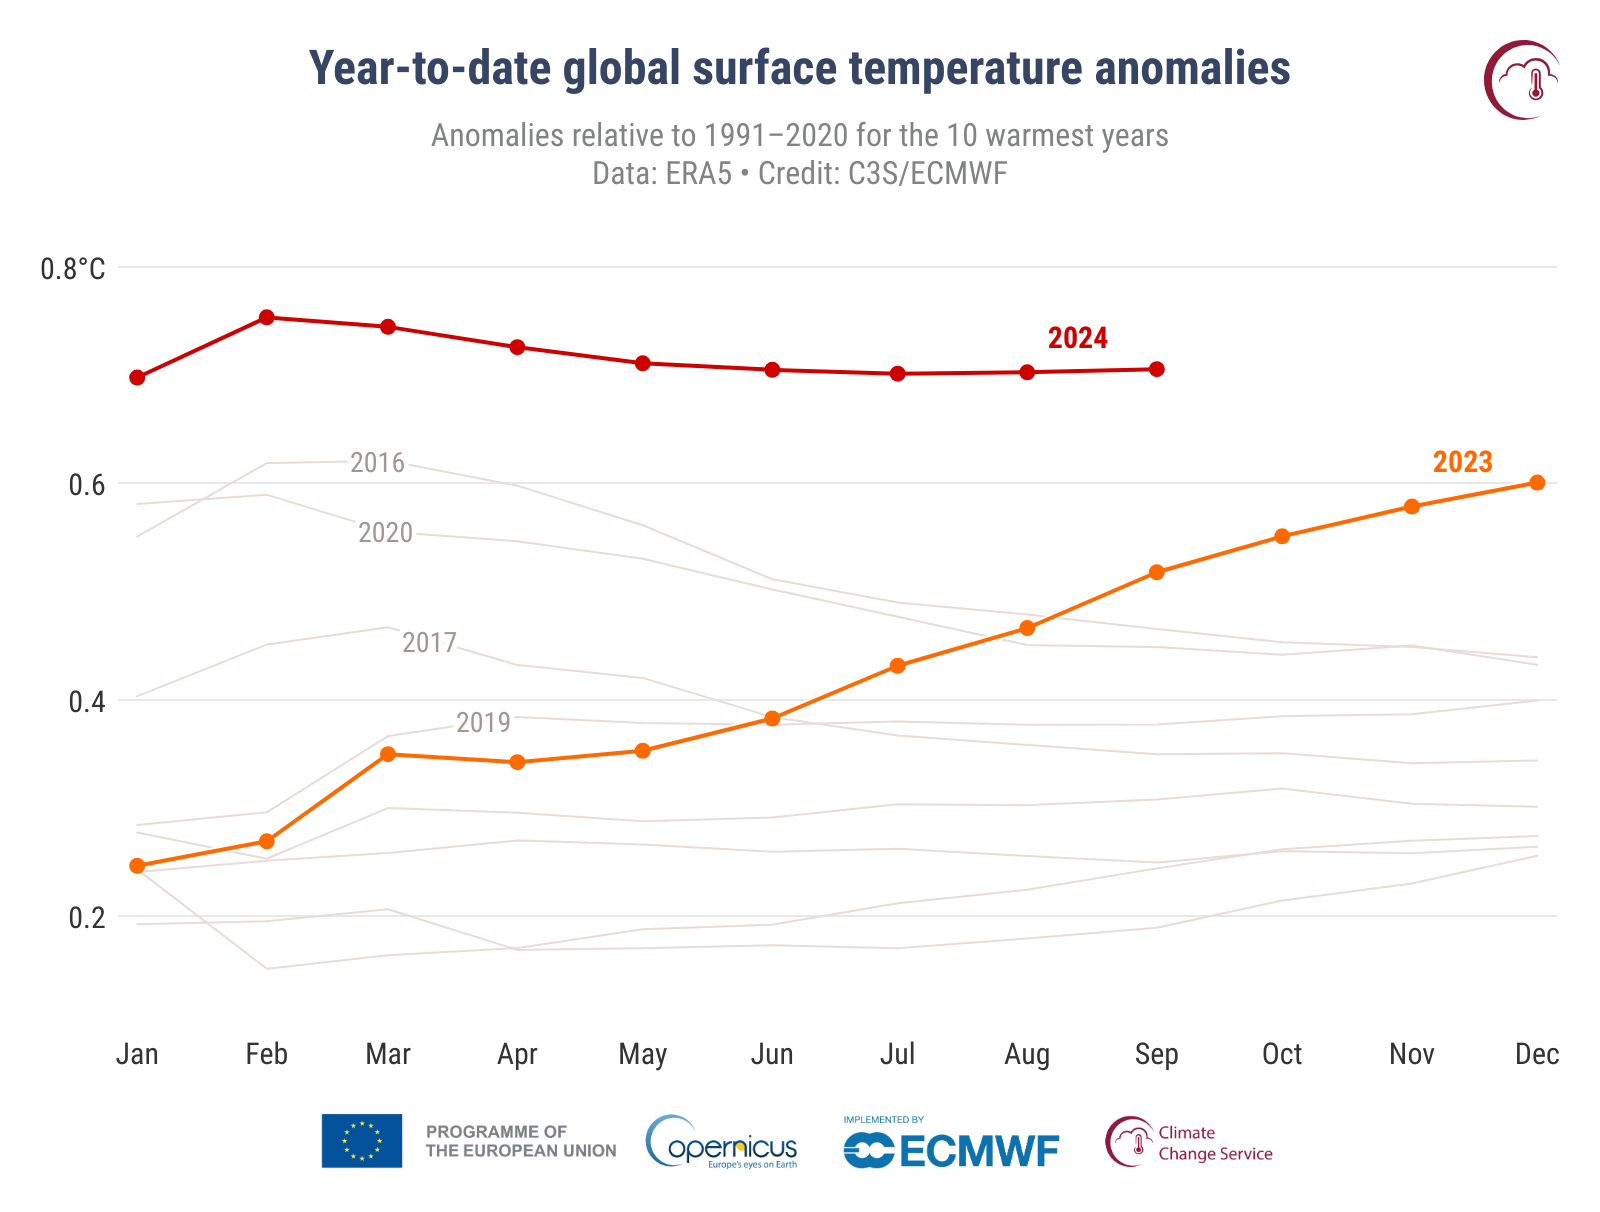
The year-to-date (January–September 2024) global-average temperature anomaly is 0.71°C above the 1991-2020 average, which is the highest on record for this period and 0.19°C warmer than the same period in 2023. The average temperature anomaly for the remaining months of this year would need to drop by more than 0.4°C for 2024 not to be warmer than 2023. Since this has never happened in the entire ERA5 dataset, it is close to certain that 2024 is going to be the warmest year on record.

The average temperature over European land for September 2024 was 1.74°C above the 1991-2020 average for September, making the month the second warmest September on record for Europe after September 2023, which was 2.51°C above average. European temperatures were most above average over eastern and northeastern Europe, but below average in a large part of western Europe, including France, most of the Iberian Peninsula, and Iceland.
Outside Europe, temperatures were most above average over Canada, the central and western United States, South America, northeast Africa, China, and Japan. Temperatures were below average over the Sahel, southern Africa, along the eastern United States, in parts of central Asia, and across west Antarctica.
The average sea surface temperature (SST) for September 2024 over 60°S–60°N was 20.83°C, the second-highest value on record for the month, and only 0.09°C below September 2023. The equatorial and central Pacific had below-average temperatures, indicating a developing La Niña; however, SSTs across the ocean remained unusually high over many regions.
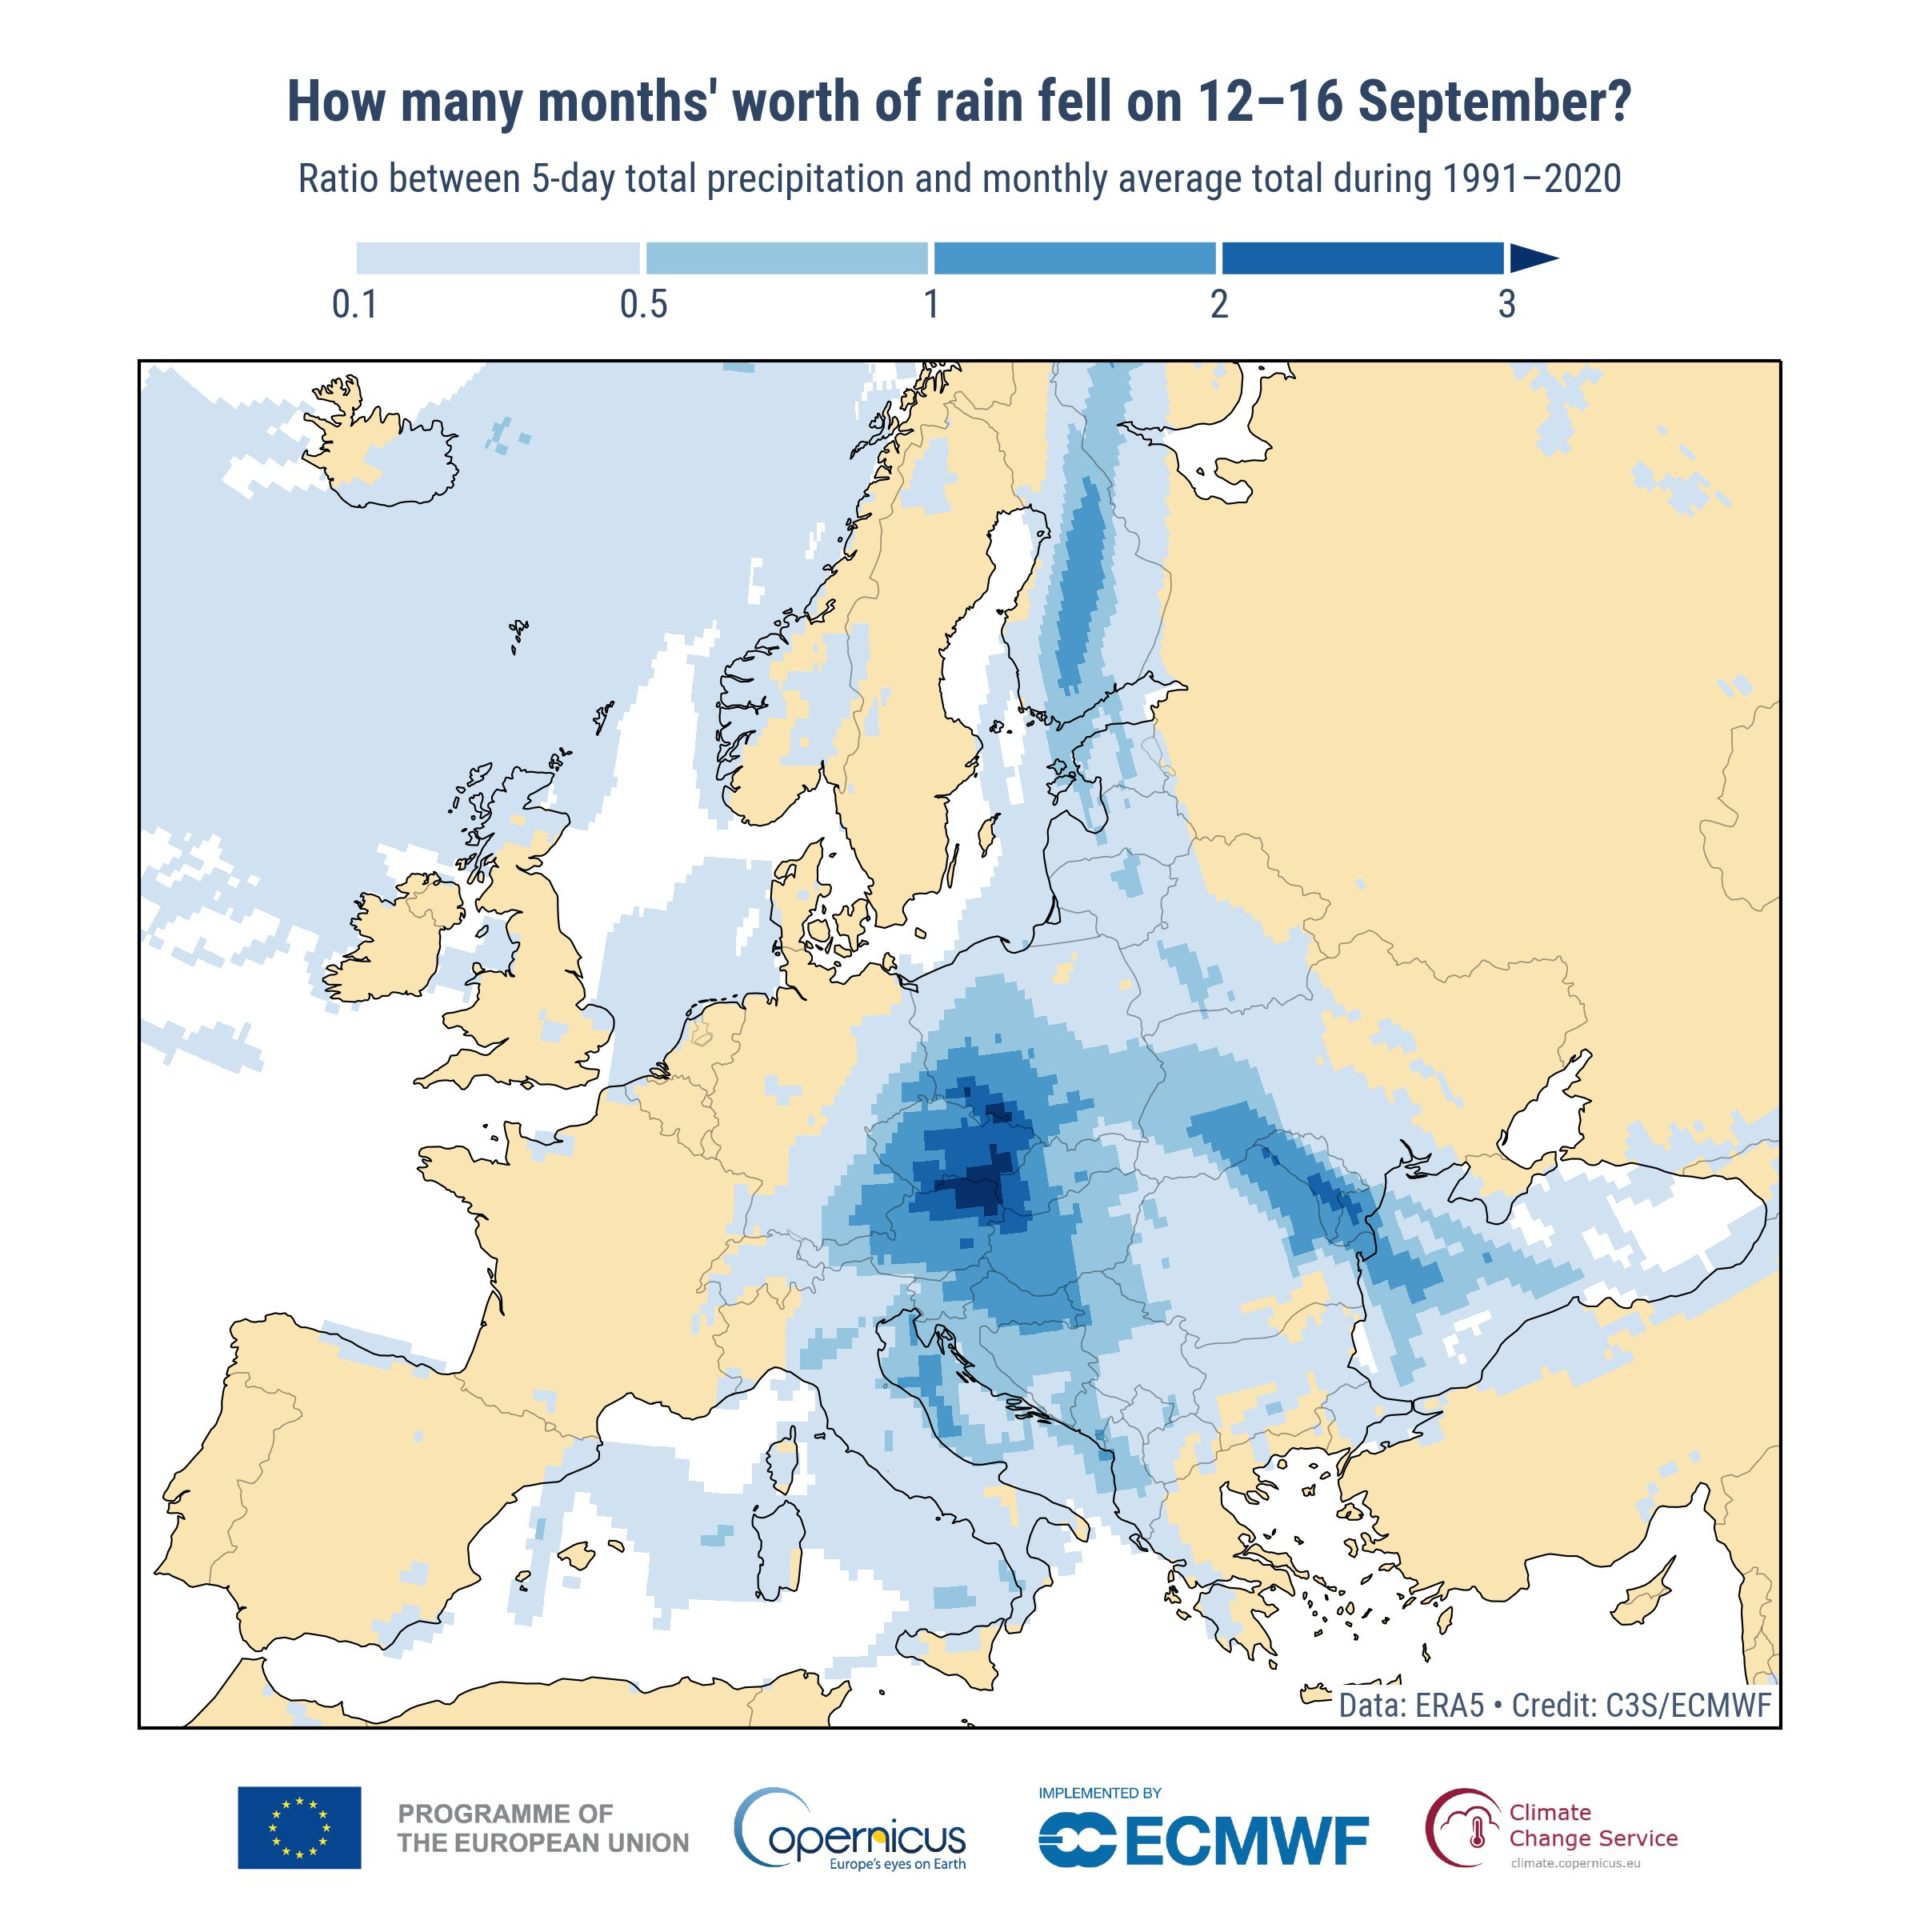
“September 2024 was the second warmest both globally and for Europe. The extreme rainfall events of this month, something we are observing more and more often, have been made worse by a warmer atmosphere, leading to more intense rainfall with months’ worth of rain falling in just a few days. The risk of extreme rainfall will continue to increase with rising temperatures; the sooner we reach NetZero emissions, the sooner we can mitigate this risk.”
— Samantha Burgess, Deputy Director, C3S

September 2024 saw much of Europe experiencing above-average precipitation. Storm Boris led to heavy rainfall, floods and associated damage in the middle of the month over Central and Eastern Europe. Conversely, it was drier than average over Ireland, northern UK, and over most of Eastern Europe and over the western and southern Iberian Peninsula, where severe wildfires were observed. Storm Boris brought unprecedented amounts of snowfall to the North-Eastern European Alps.
September 2024 was mostly wetter than average over several regions of North America, with the southeast hit by Hurricane Helene. Wetter-than-average conditions were also experienced over northern Africa, north-eastern Russia, eastern China, north-western Australia, southernmost Africa, and southernmost Brazil. Taiwan and the Philippines were hit by Typhoon Krathon and Pakistan was severely affected by the monsoon. Drier-than-average conditions were seen in parts of North America, western and easternmost Russia and north-eastern China, eastern Australia, most of southern Africa and South America. Wildfire activity was observed in several regions, including Russia and South America.
According to Copernicus’ provisional data, the daily Arctic sea ice extent reached its sixth-lowest annual minimum while the monthly sea ice extent ranked fifth-lowest in the satellite record, at 19% below average. Sea ice concentration anomalies were well below average in all peripheral seas of the Arctic Ocean. Meanwhile, NASA’s data suggested that the Arctic ice shrank to its seventh-lowest Arctic ice level since records began in the late 1970s.
- Related: September Data Shows Record High Temperatures in Sourthern Greenland & Decreasing Arctic Ice
Meanwhile, Antarctic sea ice reached its annual maximum extent but remained at near-record-low levels for this time of year, with a monthly value 7% below average, the second-lowest extent for September, behind September 2023. Sea ice concentration anomalies in the Southern Ocean were dominated by much below-average concentrations in the Indian Ocean sector. Copernicus’ data is at this point provisional since there were missing satellite observations between September 12 and 18. However, NASA’s data also confirms this observation by Copernicus. NASA suggests that Antarctic ice shrank to just over 6.6 million square miles (16.96 million square kilometers) this September. The average maximum extent between 1981 and 2010 was 7.22 million square miles (18.71 million square kilometers).
The meager growth in Antarctic ice in 2024 prolongs a recent downward trend. Prior to 2014, sea ice in the Antarctic was increasing slightly by about 1% per decade. Following a spike in 2014, ice growth has fallen dramatically. Scientists are working to understand the cause of this reversal. The recurring loss hints at a long-term shift in conditions in the Southern Ocean, likely resulting from global climate change.