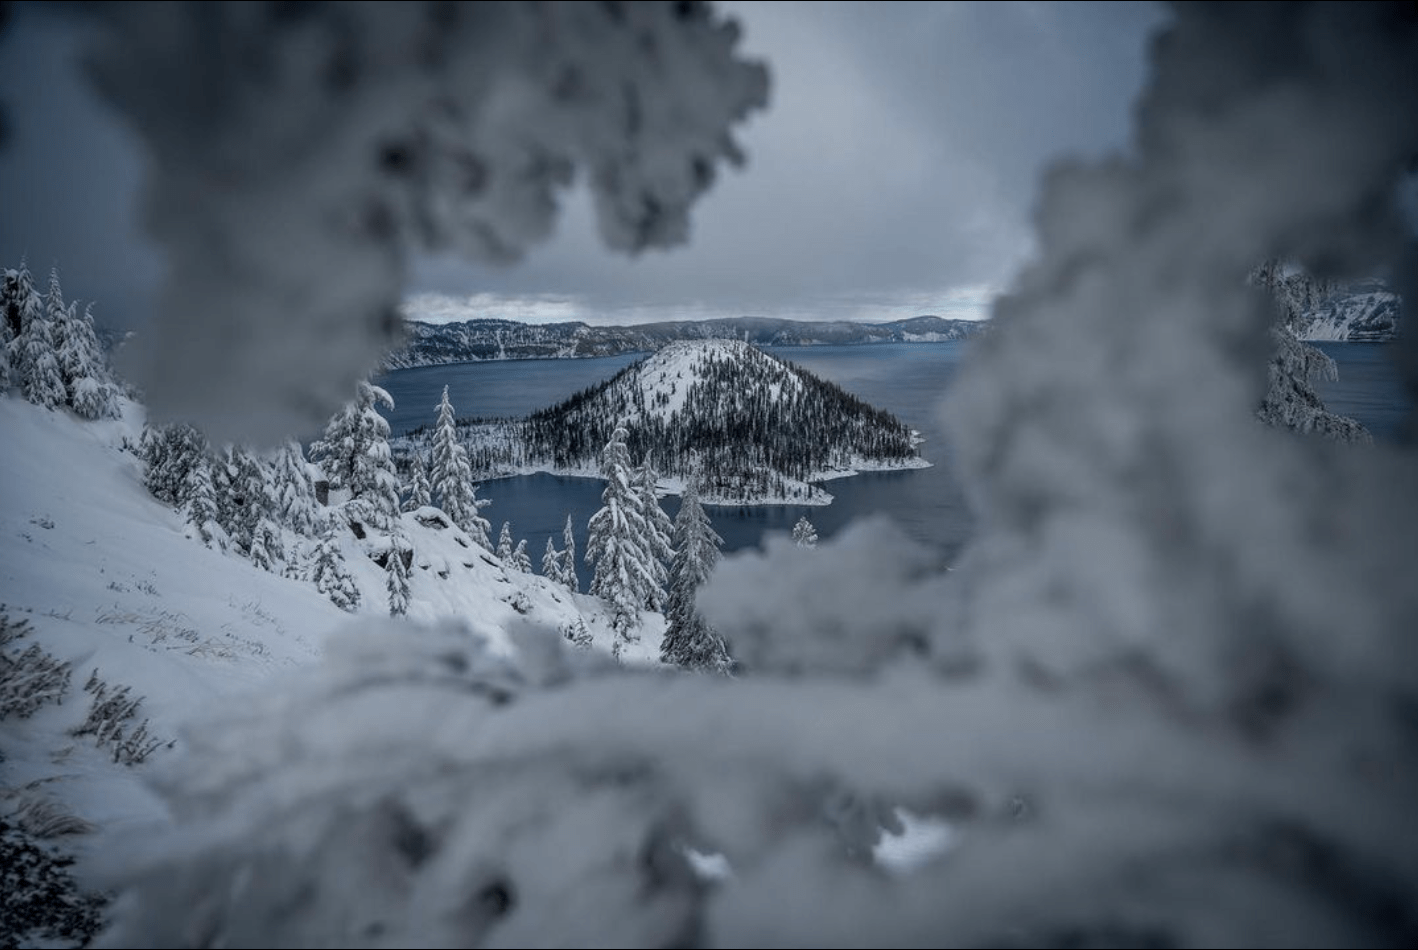
It’s safe to say that winters at Crater Lake, OR, tend to be legendary for many reasons. And I’m sure anyone reading this knows what I’m referring to. But if you are new to this, you are in for a treat.
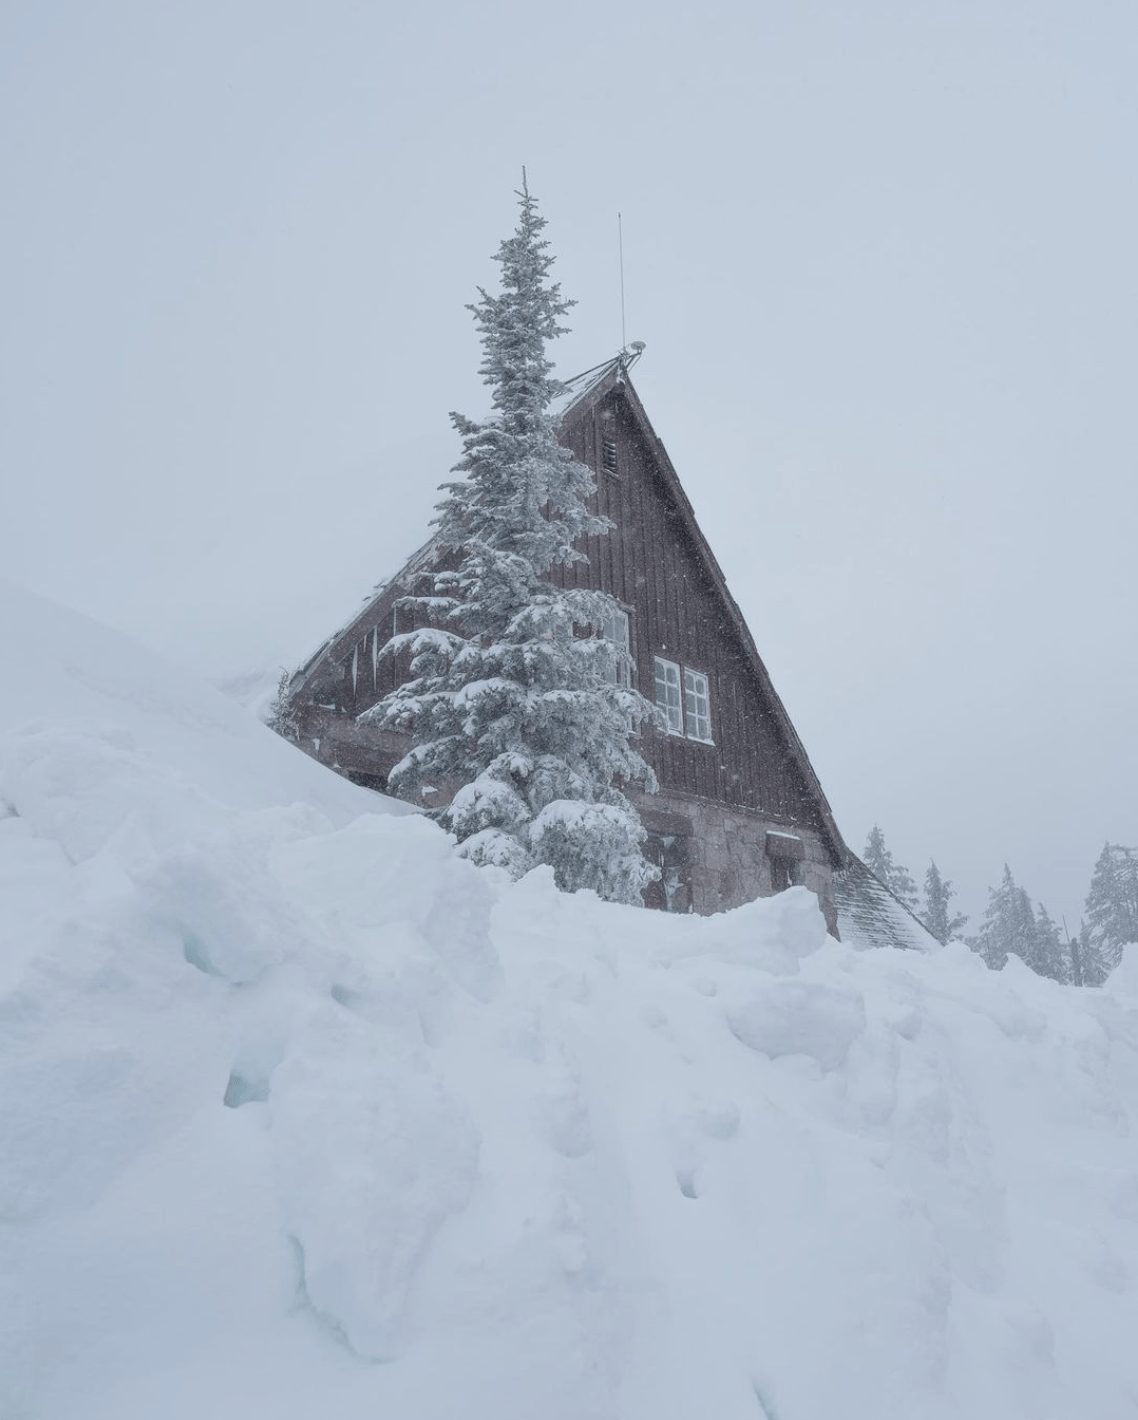
Let’s start by gaining some context on the history of the park and snippets into its geologic past and present. Then we will look at this past 2022/2023 winter season and how it compares to past winters at this pure gem on the crest of the Oregon Cascades. Crater Lake National Park was established as a National Park on May 22nd, 1902. It is America’s 5th oldest park and Oregon’s only national park.
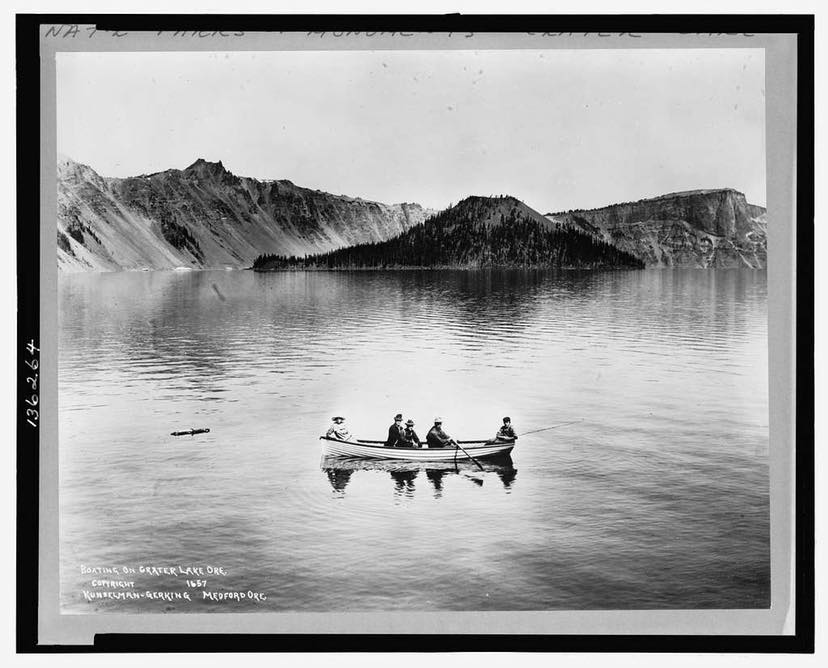
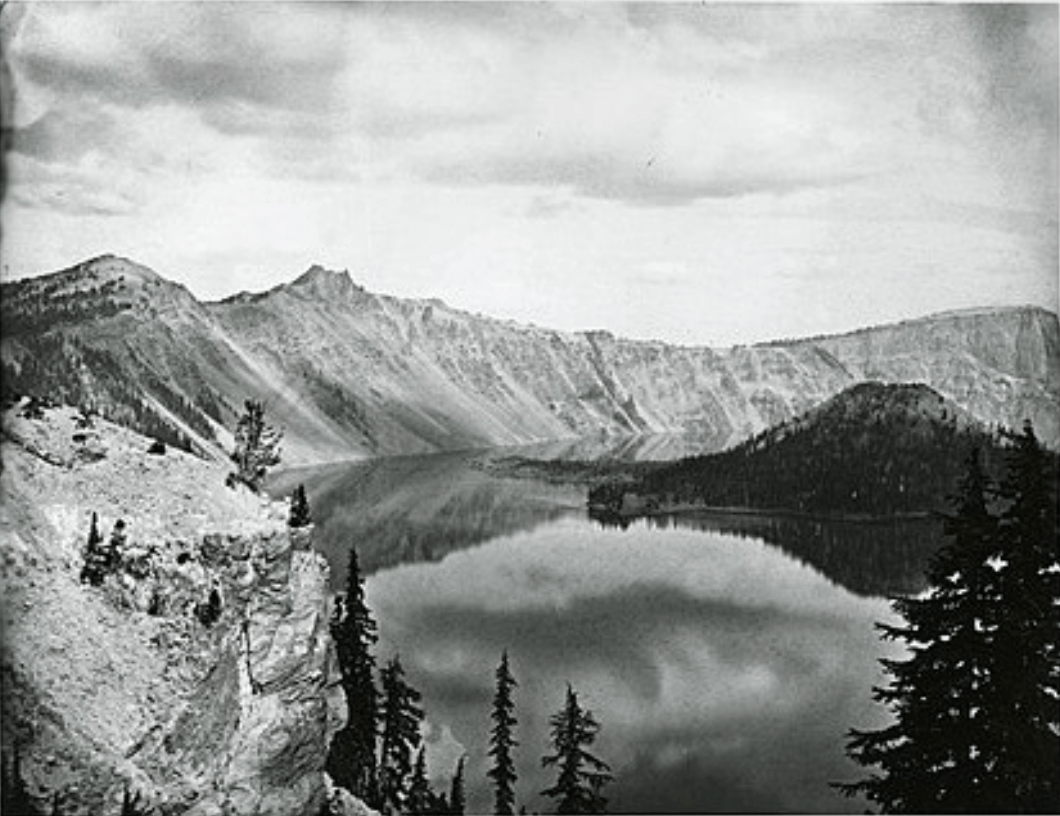
Crater Lake’s beginnings emerged from the destructive eruption of Mt. Mazama (~12,000 ft or 3700 m) approximately 7,700 years ago, where it effectively exhausted itself by depleting so much of the inner foundation (magma reservoir) of the volcano that it buckled and collapsed to form this spectacular five by 6-mile wide caldera. This caldera rim fluctuates in elevation from roughly 7,000 ft to over 8,000 ft. There are endless tidbits of information on this geological masterpiece in Southern Oregon.
Let’s shift gears and dive into the 2022/2023 winter season and how it measures up to the historical data.
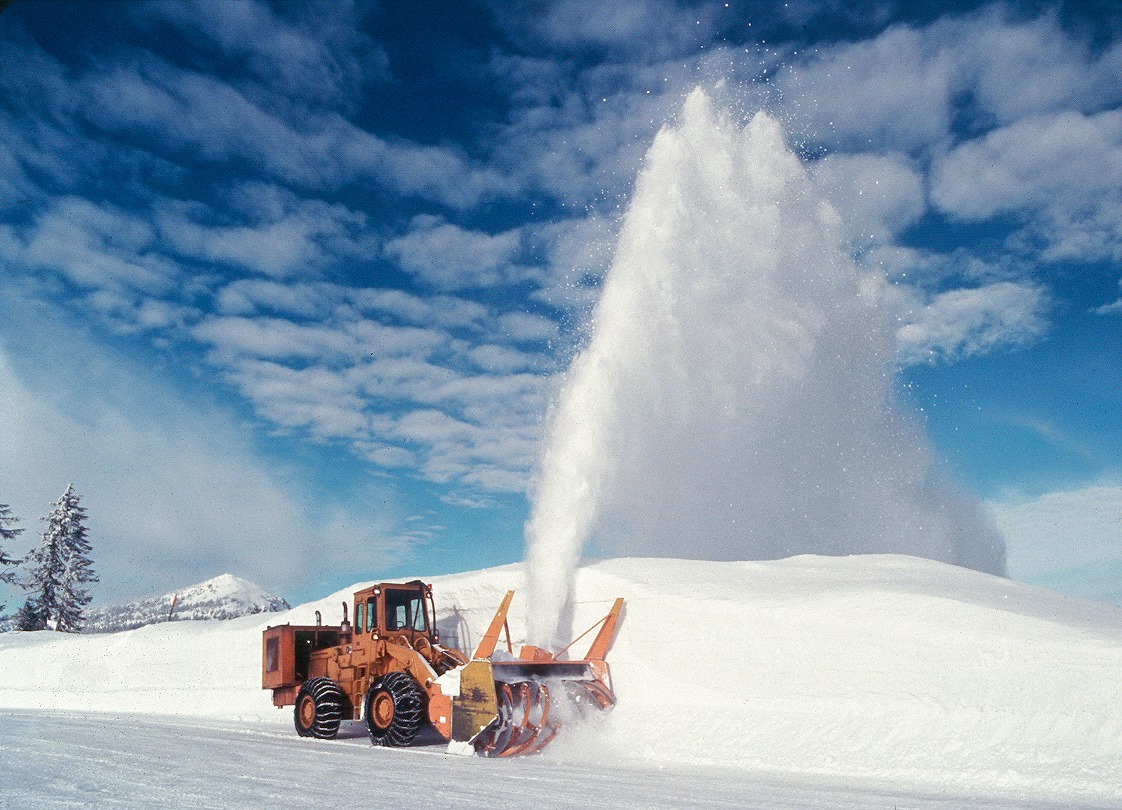
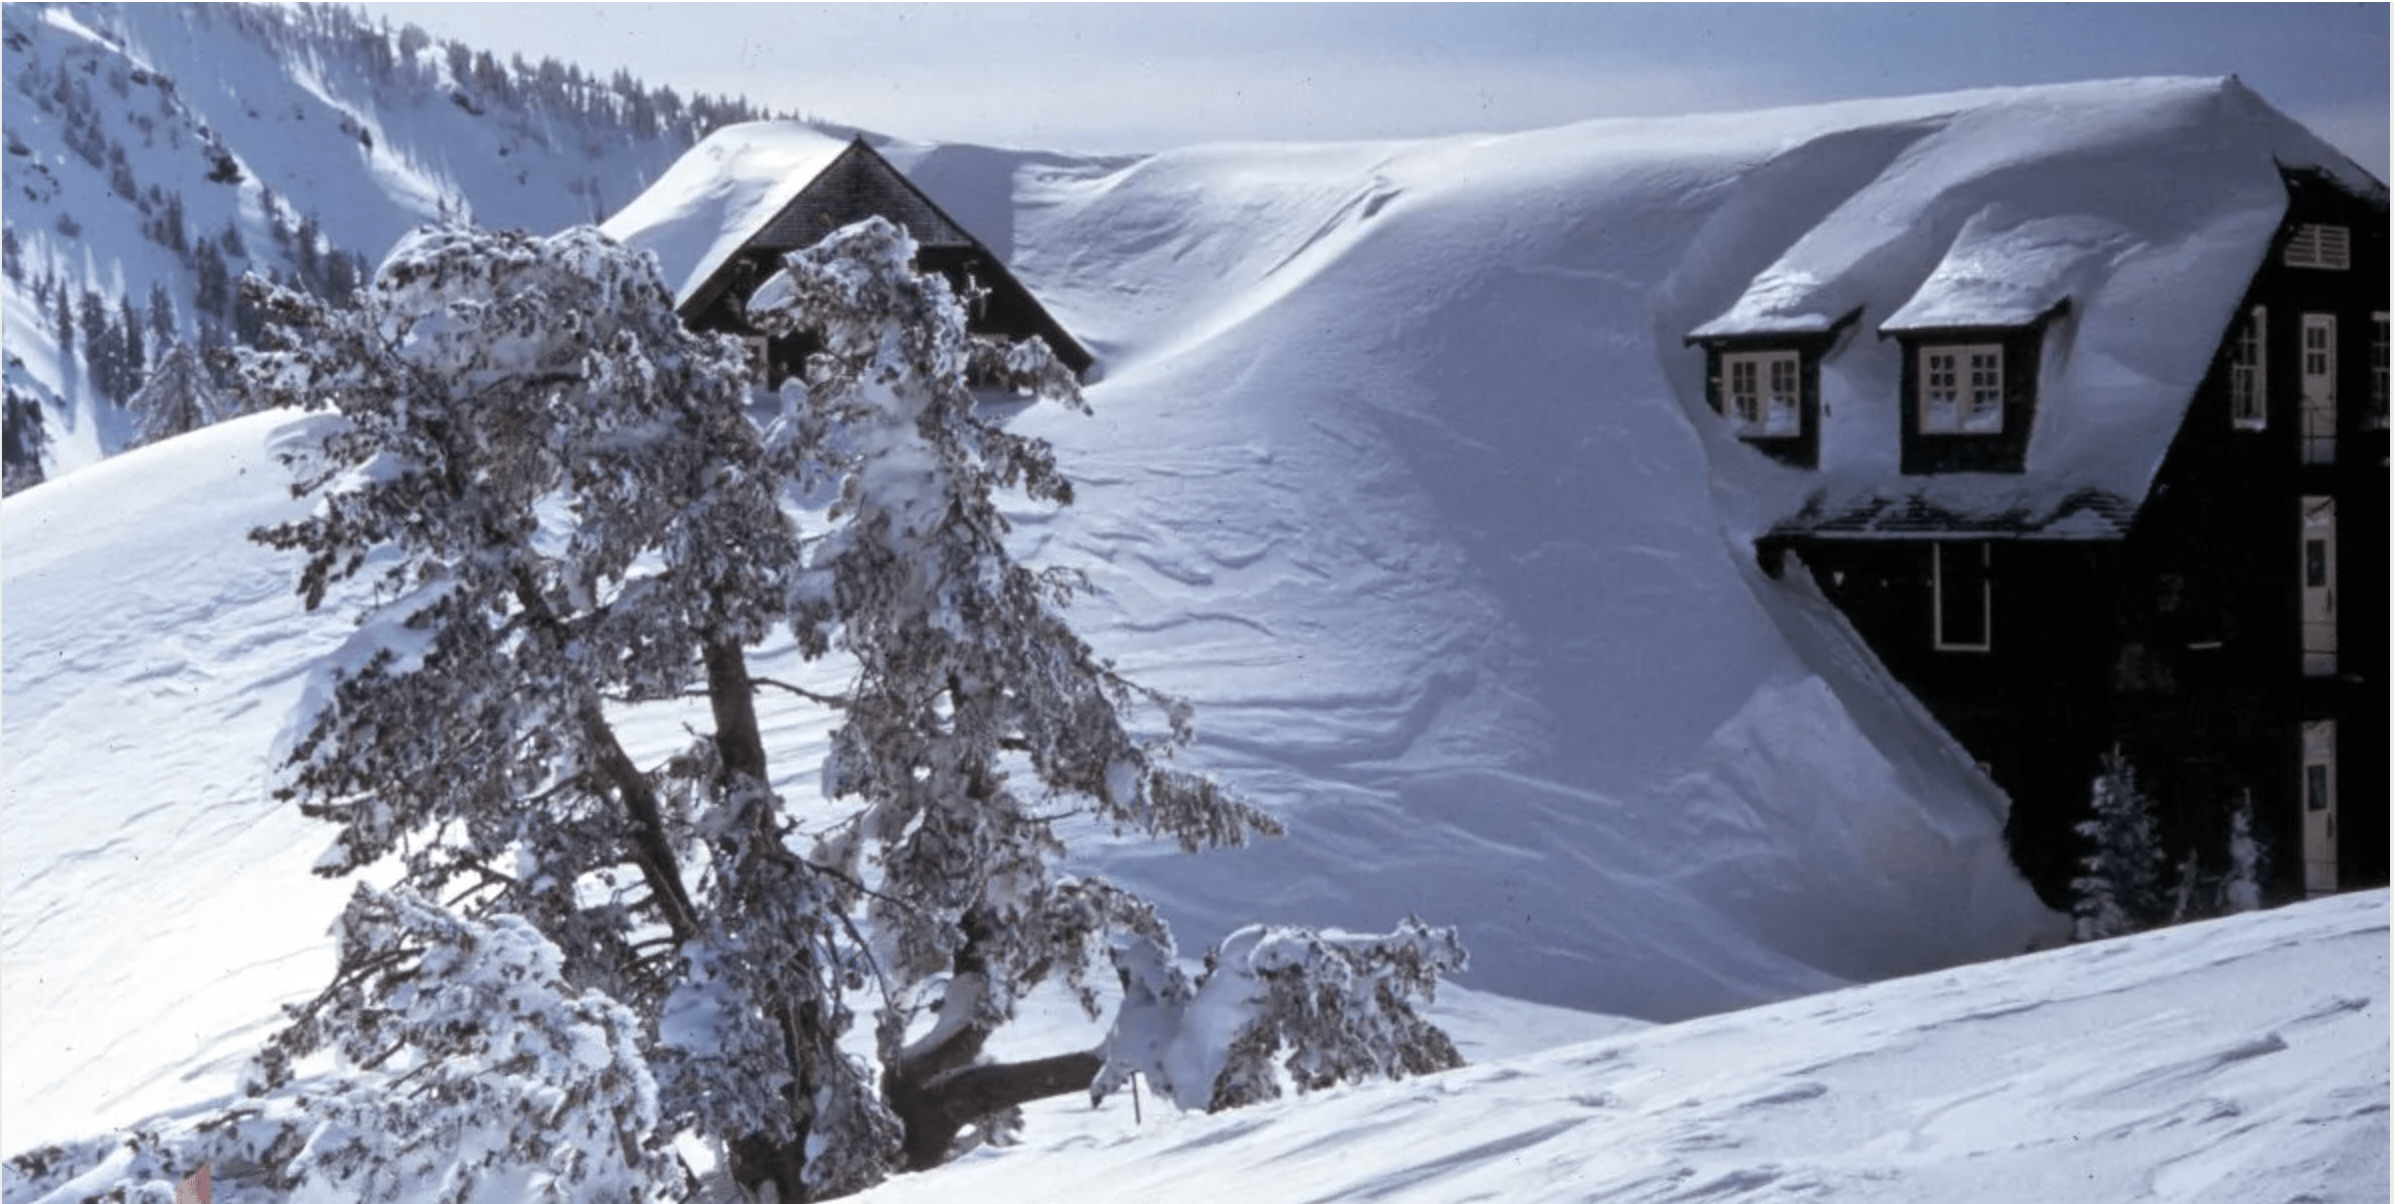
On a high note, this year’s annual snowfall was 624 inches (52 ft). The average yearly snowfall is ~524 inches (43.6 ft), equalling a gain of 19% above average. The real kicker is how much snow was on the ground this season. The numbers are in. The last recorded snow measurement on April 8th, 2023, measured an impressively robust 177 inches of snow on the ground @ 6,500 ft. For context, the average for this time of year is ~104 inches. This average looks at the historical mean data from 1991 to 2020. For added context, the mountain snowpack typically peaks (pun intended) during April.
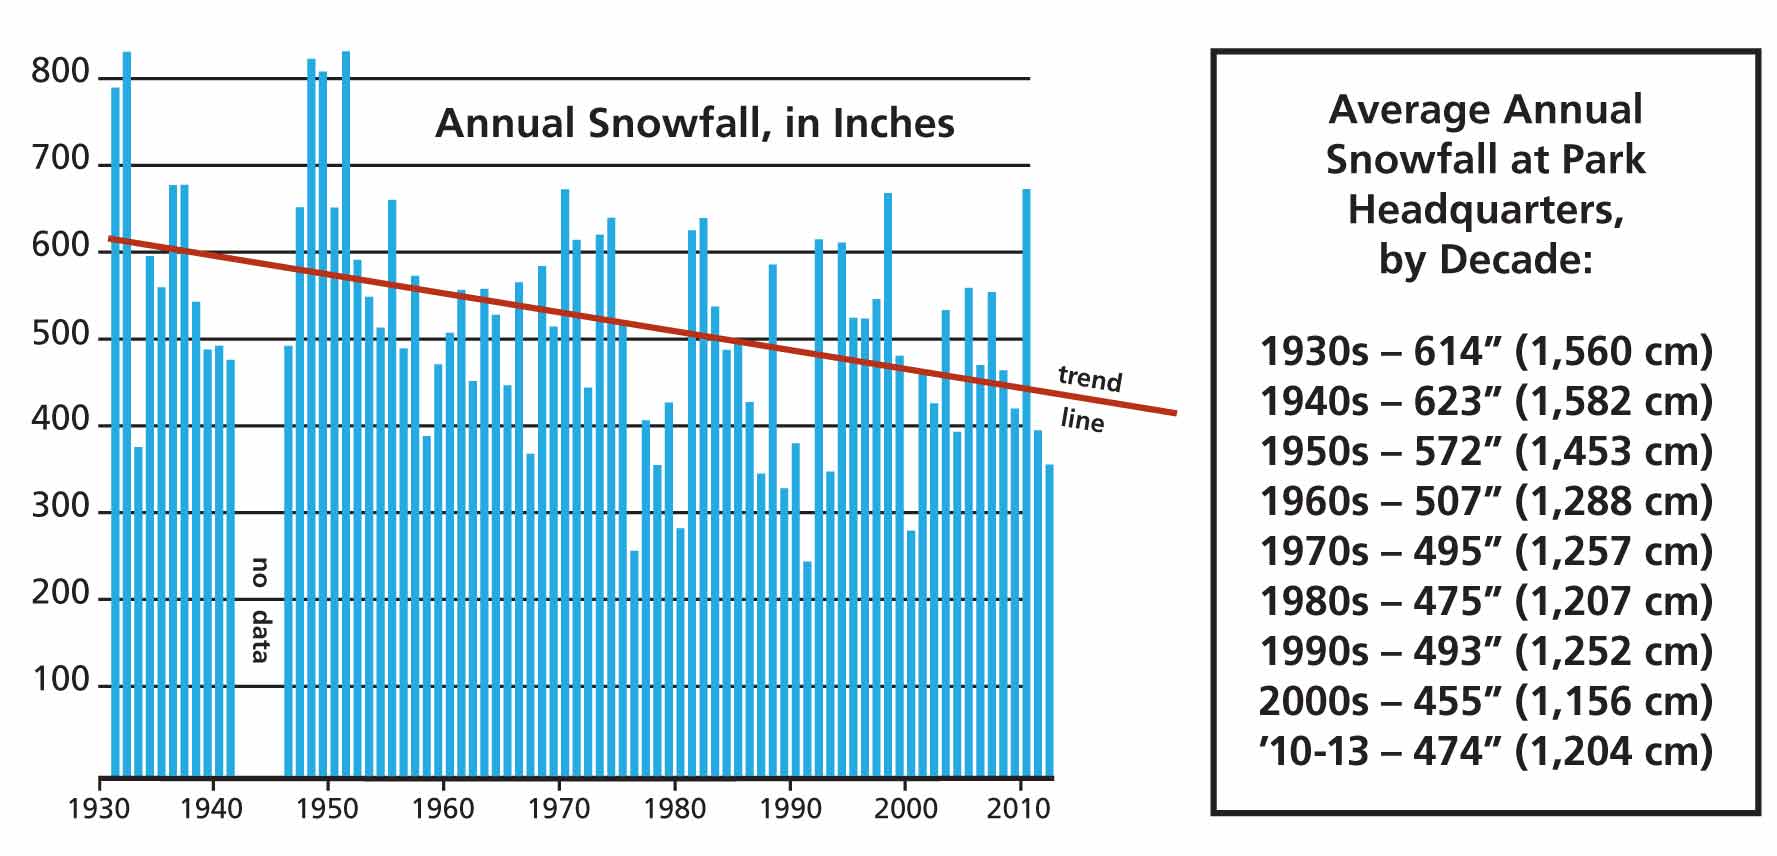
So how does the recent snowfall of 624 inches compare to other big snow years at Crater Lake? During the winter of 1932 – 1933, an astounding 834 inches (69.5 ft) of snow had fallen. That’s roughly 200 inches of more snow compared to the most annual total snowfall. What is also quite interesting is that the deepest recorded snowpack (amount of actual snow on the ground) came in at 252 inches (21 ft) back on April 3rd, 1983. This does make you wonder what the total annual snowfall was for the 1932 -1933 season.
This rather eye-opening graph below does reflect a downward trend. As shown below, from the early 1900s to the mid-1900s, it averaged 500 to 600 inches of annual total snowfall. However, as you move into the 1970s, you can see a subtle decline up to where we are now. You can piece together that Crater Lake, on average, is getting about ~100 to 140 inches of less total snowfall per year.
To wrap things up, one could say that winter at Crater Lake National Park is changing. Based on the above data, one could hypothesize that the total precipitation might not necessarily trend down during winter. But perhaps it’s the type of precipitation falling at the park. Meaning more rain than snow might be falling during the wet season at the park. It will be interesting to see what unfolds in the coming decades.
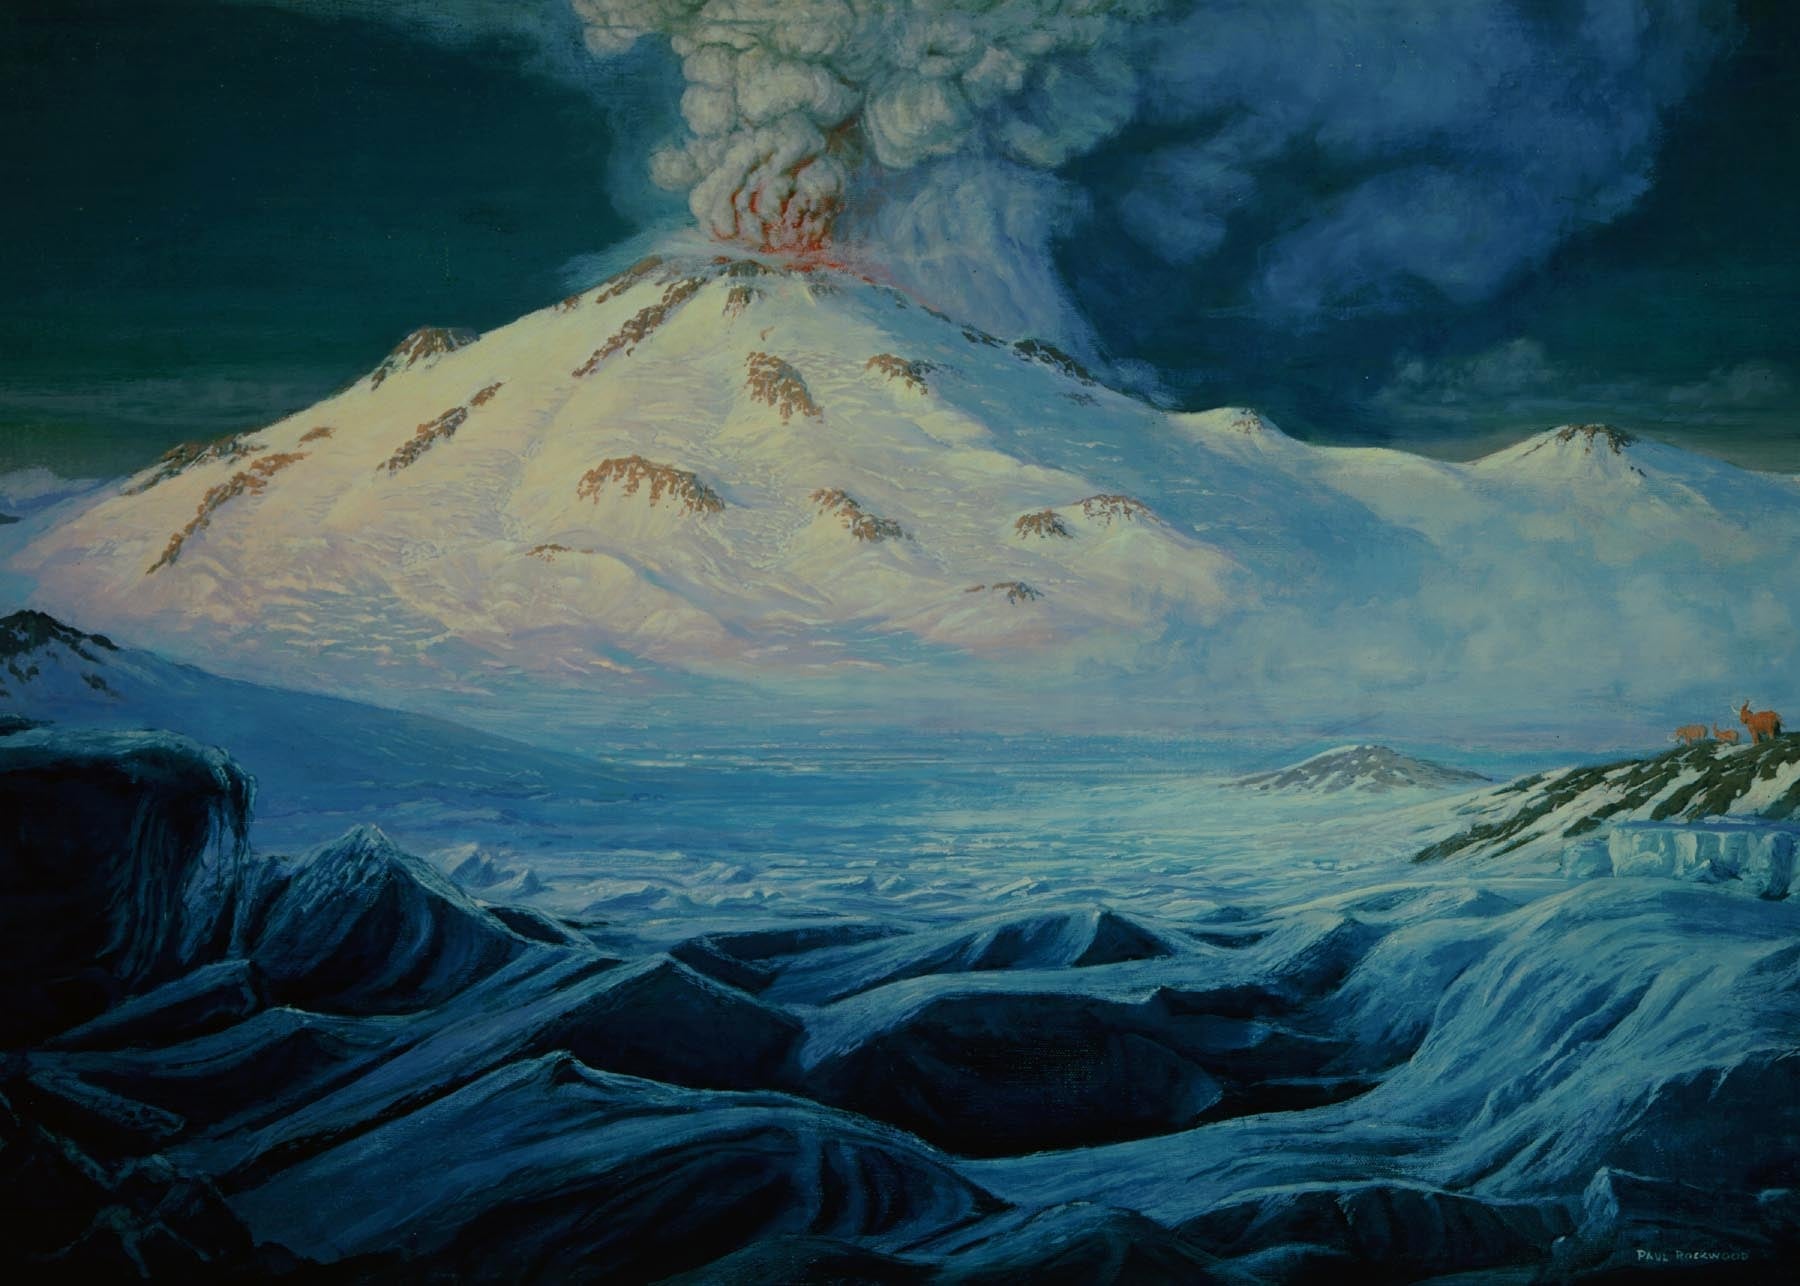
Here is an interesting idea to play with! Can you imagine what the winters were like when Mt. Mazama was still standing at its commanding ~12,000 ft? It makes you wonder if this volcano received even more snow than it currently gets.
