This article originally appeared on climate.gov
The chance that our young El Niño will continue through the winter is greater than 90%. Why are forecasters so confident? What are the chances of a strong El Niño? And what effect does El Niño have on global climate patterns? We have a lot to talk about today, so let’s get to it!
Tumbling class
The Niño-3.4 Index, which measures the temperature of the surface of the central tropical Pacific Ocean, is our primary metric for El Niño. It was 0.8 °C (1.4 ˚ F) above the long-term average (long term = 1991–2020) in June, according to our most consistent dataset, ERSSTv5. This is comfortably above the El Niño threshold of 0.5 °C.
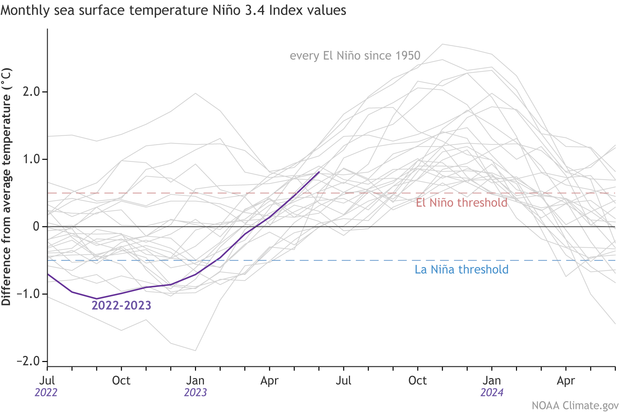
The three-month-average Niño-3.4 Index, the Oceanic Niño Index (ONI), was 0.5 °C for April–June 2023. In order to qualify as an El Niño year and be colored red in our historical record, the ONI must be at or above the threshold for at least 5 three-month periods. In this case, El Niño conditions would need to last through at least the August–October average to qualify. We have a confident forecast for this… but I’m getting ahead of myself. Back to the present!
Middle school dance
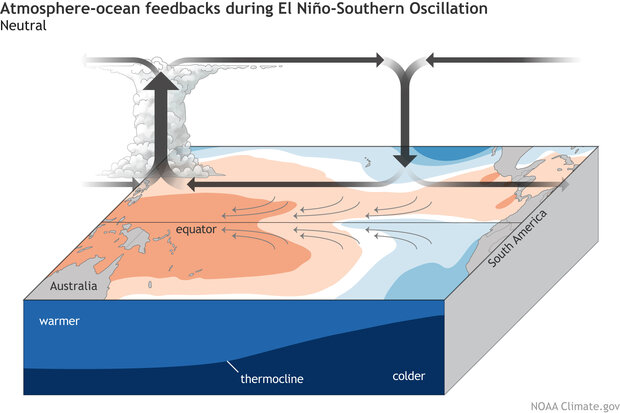
El Niño is a coupled climate pattern, meaning the changes in the ocean temperature are paired with changes in the atmosphere. These changes show up in the Walker circulation, the large-scale atmospheric circulation pattern over the tropical Pacific. The average Walker circulation is driven by the very warm waters in the far western Pacific and consists of rising air and storms over the far western Pacific and Indonesia, west-to-east winds aloft, descending air and dry conditions over the eastern Pacific, and the trade winds, east-to-west surface winds.
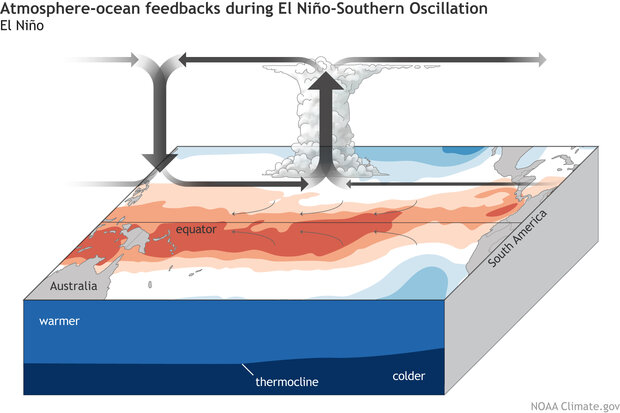
El Niño shifts this circulation by increasing the amount of rising air, clouds, and rain over those warmer-than-average waters in the central Pacific. The trade winds and the upper-level winds slow, and the overall circulation weakens. The weaker trade winds allow the surface to continue to warm, and a feedback mechanism is born. For more details on this feedback, check out Michelle’s excellent (and tasty) post.
Evidence for the atmospheric part of El Niño includes changes in tropical Pacific winds and cloud patterns. At this early stage of El Niño, the atmospheric response is present, but still quite weak, especially relative to the oceanic anomalies. We did observe more rain and clouds over the central Pacific and some drier conditions over Indonesia, which is typical for El Niño. Also, the Equatorial Southern Oscillation Index, a measure of the Walker circulation strength, was in the bottom quarter of all June values, so respectably negative (negative indicates weaker). However, stronger El Niño events are usually preceded by bursts of much weaker trade winds, but we haven’t seen much of those so far.
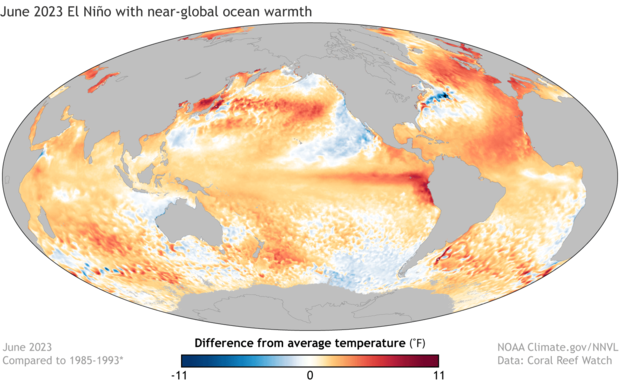
Winds and atmospheric conditions always fluctuate more from month to month than ocean surface temperatures, so this weak response isn’t a reason to doubt the forecast… yet. It’s still very likely that El Niño will continue at least through the end of the year, but this El Niño is taking place in the context of a very warm global ocean, and we don’t know how the warm globe will affect El Niño’s atmospheric conditions.

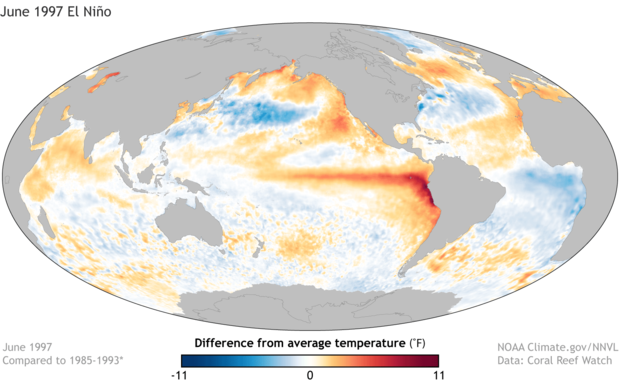
One potential outcome is a weaker atmospheric response than we might otherwise expect. The strength of the atmospheric response is related to the pattern of sea surface temperature throughout the tropics. When El Niño is clearly the loudest voice in the room, as it was during the 1997–98 El Niño, the atmospheric response is clear. However, when the western Pacific and the rest of the tropics are also warm, the response may be more muddled. This outcome is important not just for El Niño itself, but also because many of El Niño’s impacts on global weather and climate patterns are communicated around the world via these atmospheric changes.
The Nutcracker
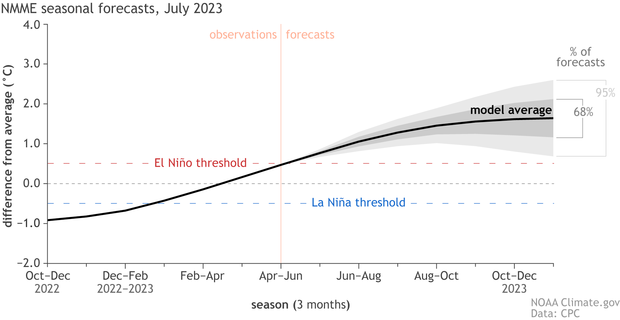
Now it’s time to talk forecast. Our computer climate models are consistently predicting that El Niño will continue through the winter, providing a major source of confidence.
Also, there is quite a lot of warmer-than-average water under the surface of the tropical Pacific. In fact, the temperature of the subsurface in June 2023 was the third-warmest June value in our record, which goes back to 1979. This warm subsurface will feed the surface for the next few months, helping to sustain El Niño conditions.
How about potential strength? El Niño’s maximum Niño-3.4 Index values, aka its peak, almost always occur in November–January. We estimate about an 80% chance that this El Niño will peak with a maximum Niño-3.4 Index of at least 1.0 °C, a 50% chance of at least 1.5 °C, and a 20% chance of above 2.0 °C. These thresholds are, respectively, how we categorize moderate, strong, and very strong El Niño events, but this is just an informal classification. Generally, the stronger the sea surface temperature anomaly, the stronger the atmospheric response, and the more consistent the pattern of El Niño’s remote impacts on rain and temperature patterns. However, as I mentioned above, the warm global ocean may complicate this relationship.
Touring production
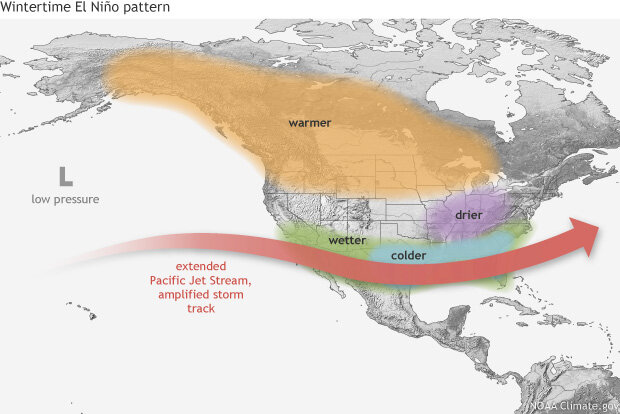
That said, El Niño is still our best source of information for upcoming seasonal weather and climate, despite operating against a backdrop of higher global temperatures. El Niño’s impact on global precipitation and temperature patterns is strongest in the Northern Hemisphere winter, both because that’s when El Niño reaches its peak, and because the jet stream, which is influenced by El Niño, is a major player for winter weather.
Other parts of the globe may see impacts before that. June-August dryness is common for India, the Maritime Continent, eastern Australia, and the Caribbean. Warmth is common in the Caribbean and parts of South America. And then there’s the hurricane seasons in both the eastern Pacific and Atlantic Oceans.
NOAA’s Climate Prediction Center prepares outlooks for upcoming seasons, which take El Niño and climate trends into account. Keep an eye on those maps for the patterns that forecasters think will be most likely later this season and for fall and winter.
So El Nino affects the 2 hemisphere`s differently? the recent La Nina seemed to help the US have massive amounts of snow for their mountain resorts, but our last summer in NZ was quite wet. In the past an El Nino winter was something to hope for, as it brought more South Westerly winds, which is where we get our heaviest snow falls from. But over recent years the high cells have been so big and strong, that they have had a dominant effect and cancelled out a lot of El Nino`s SW affect. Currently our ski resorts are looking a bit lean on snow!