This post originally appeared on climate.gov and was written by Tom Di Liberto
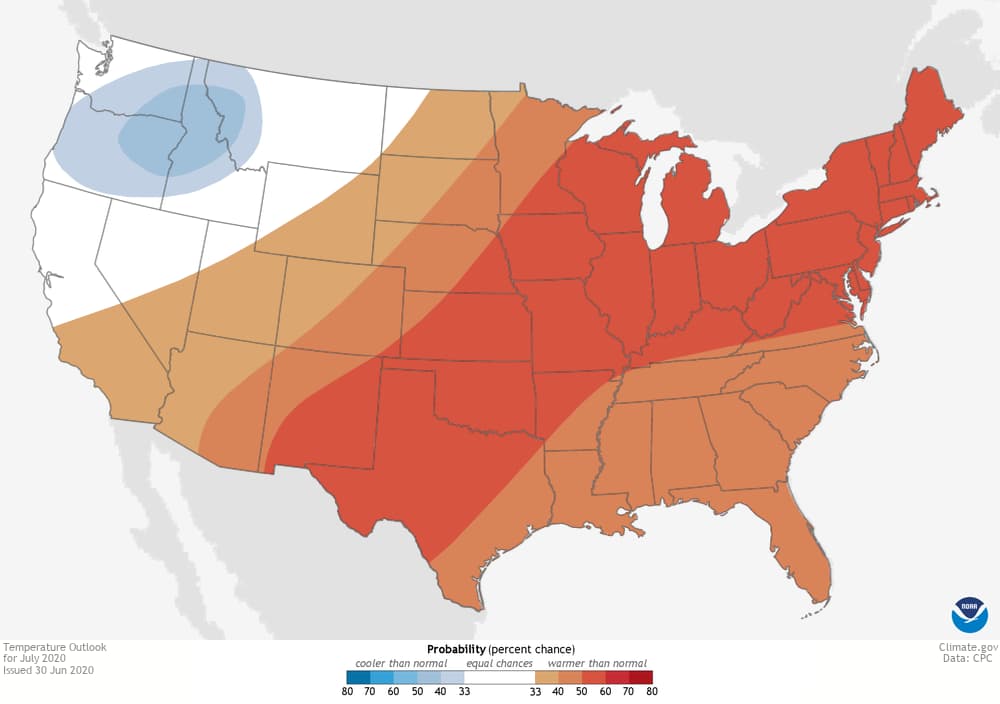
We’re entering July, the month when most locations across the United States observe their hottest day of the year. And as we move into the sweltering days of mid-summer, odds favor a warmer-than-average July for many areas across the contiguous United States. So break out those fans, remember ways to beat the heat and stay safe, and stick around as we dive into the July 2020 outlook for temperature and precipitation from NOAA’s Climate Prediction Center.
As a reminder, the monthly outlooks from the Climate Prediction Center are not predictions for the actual temperature or precipitation amount on any given day in July. Instead, the outlooks provide the probability (percent chance) that July temperatures and precipitation at any location will be in the upper, middle, or lower third of the climatological record (1981-2020) for July. (As shorthand, we often describe the upper and lower thirds as “well above” and “well below” average, or we say “much wetter” or “much cooler” than average.) The colors (red or blue for temperature; brown and teal for precipitation) indicate which outcome is most likely. Darker colors mean higher chances; not more extreme conditions.
Warm July more likely than a cool one
A theme in these monthly outlook posts of late is that often the majority of the country is favored to be well above average. July is no exception. Outside a potentially cooler-than-average Pacific Northwest, the rest of the contiguous United States is facing elevated chances of July temperatures that are well above average. The highest probabilities (50-60%) fall across a broad area of the country, stretching from the Plains across the Midwest, and into the Mid-Atlantic and Northeast.
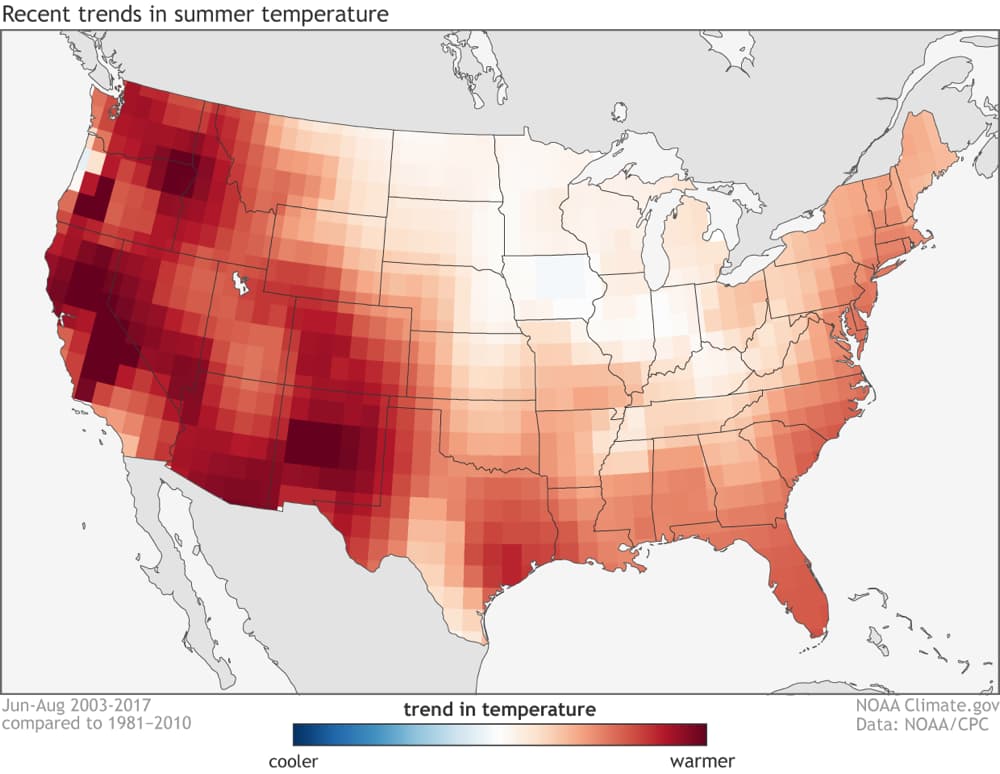
The widespread favoring of warmer-than-average months in June and July follow along with how temperatures have warmed over the recent past, otherwise known as ‘”recent trends.” During the summer months, there is a clear warming trend when compared to fifteen years ago.
A game of rainfall checkers
The precipitation outlook looks like a game of checkers, with four squares colored brown and teal. A much wetter than average July is favored across the Southeast and far northern Plains. Meanwhile, a tilt in the odds towards a drier-than-average July has been issued across the southwestern United States, Great Lakes, and northern New England.
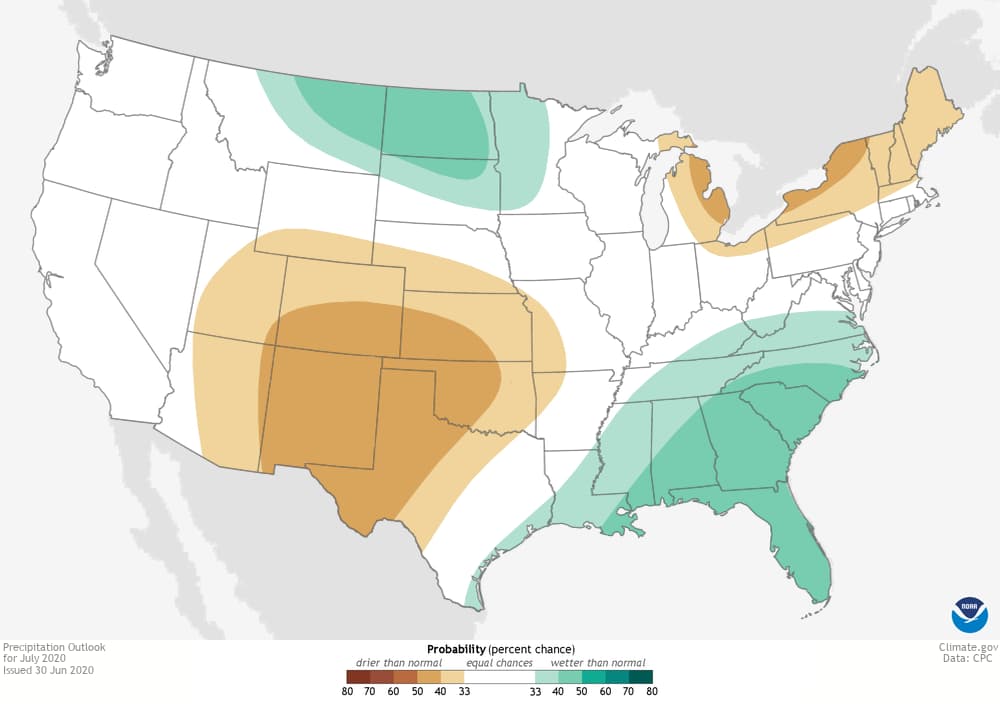
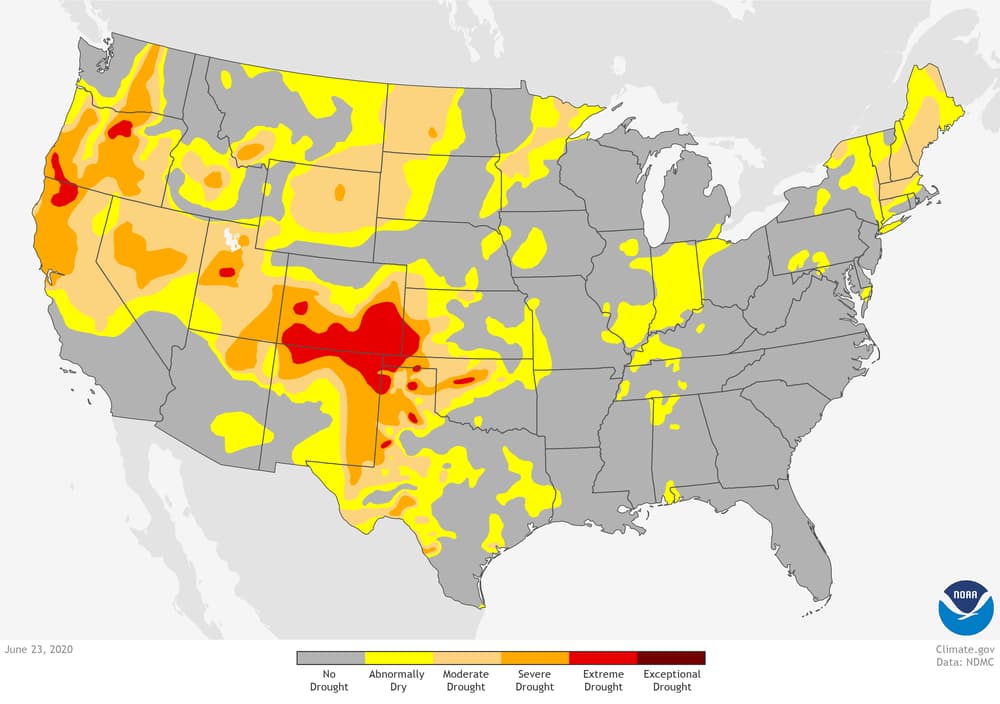
This is not a great forecast for many areas in the Southwest which are currently in various levels of drought. A wide area along the Colorado/New Mexico border is under D3-Extreme drought, the second-highest level.
Obligatory explanation for all those white areas labeled EC
The Climate Prediction Center’s climate outlooks actually give probabilities for three possible outcomes: well above average, well below average, and near average. On a single map, though, we have to pick one color to show, so we show the outcome with the highest chances. If a red area on the temperature map shows a 60 percent chance of well above average temperatures, then the odds of near-average temperatures are 33.3 percent, and the odds of well below average temperatures are close to 7%. But if scientists see no clear climate reason to favor one outcome over the others, they can assign the same 33.3% chance to all three outcomes. We call this “Equal Chance” or EC. Importantly, white “EC” areas DO NOT mean average conditions are favored.
What do these maps tell us about the Southwest Monsoon?
For the U.S. Southwest, the July climate outlook favors both a warmer-than-average month and a drier-than-average month. These factors often go hand in hand. Dry conditions often beget warmer-than-average air temperatures, which accelerate evaporation, which in turn leads to drier conditions. What does this have to do with the Southwest Monsoon?
If you take a quick look at our map showing the normal hottest day of the year, you’ll see that the Southwest tends to have its hottest day of the year earlier than other states along our country’s southern tier. One reason the Southwest tends to see its warmest day of the year in June or early July is that by the second half of July into early August, rains associated with the Southwest Monsoon normally arrive, lowering temperatures.
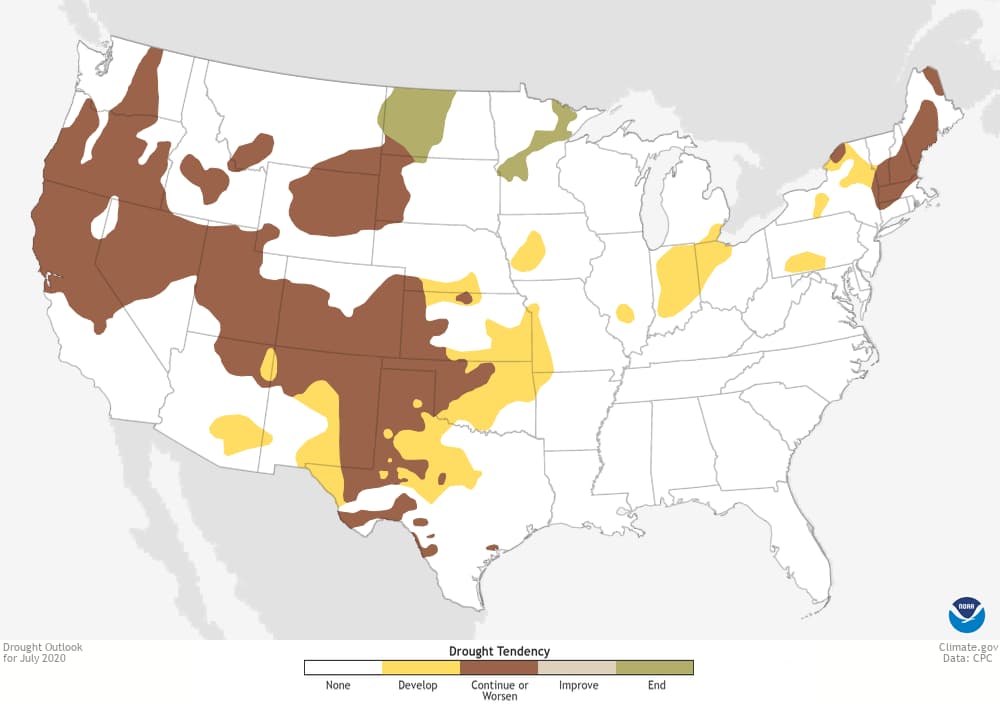
So a forecast for well below-average precipitation and well above average temperatures indicates that forecasters think there are higher odds of a delayed or weak onset of the Southwest Monsoon for the region. This disruption to the normal monsoon is also a reason why the monthly drought outlook for July indicates drought is likely to continue or even expand in the region.
Behind the delay is a forecast of lower-than-average sea level pressure along the central U.S. West Coast, which is reflected by the cooler-than-average temperature outlook for the Pacific Northwest. This atmospheric configuration is not conducive to the set-up of the wind patterns needed to bring moisture into the Southwest from both the Gulf of California and the Gulf of Mexico.
To see the full discussion of the monthly climate outlooks from the Climate Prediction Center, including the forecasters’ reasoning behind the outlooks for other parts of the country, head to their website. And check back later this month for a recap on what happened during June in the United States and across the globe.