In late December, many Americans reached for cold-weather gear as a blast of unusually cold Arctic air poured south and fueled a travel nightmare around Christmas. In Michigan and other parts of the Midwest, a “bomb cyclone” formed along the cold front bearing powerful winds and whiteout conditions. In certain parts of upstate New York and Canada, lake effect snow supercharged the storm, with more than 50 inches (125 centimeters) falling in Buffalo over a five-day period. The sprawling cold front left its mark on the Southeast as well, where the cold air helped fuel tornadoes, disrupted power supplies, and strained water systems.
In the first few days of January 2023, conditions changed dramatically. Instead of unseasonable cold, many of the same areas experienced unusual warmth. With temperatures running 20-30 degrees Fahrenheit higher than normal in the eastern U.S., spring-like weather broke temperature records in several states. Among the places that set new temperature records: St. Louis, Missouri; Raleigh, North Carolina; Paducah, Kentucky; Mount Pocono, Pennsylvania; Atlanta, Georgia; Georgetown, Delaware; and Dulles, Virginia.
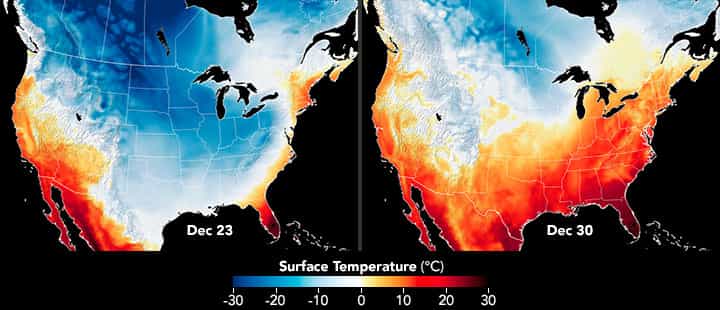
The animation above shows surface air temperature across part of the Northern Hemisphere, including North America, for December 2022 and the first few days of January 2023. It was produced by combining satellite observations with temperatures calculated by a version of the Goddard Earth Observing System (GEOS) global model, which uses mathematical equations to represent physical processes in the atmosphere. The darkest reds show areas with the warmest surface temperatures; blue areas show areas with the lowest surface temperatures.
The short pulses reflect daily daytime warming and nighttime cooling, but the spread of cold Arctic air south over much of the U.S. became apparent toward the end of the month, especially in the week before Christmas. The daily cycle is less visible over water because water more easily retains heat and maintains a more consistent temperature. Many areas saw temperature swings that ranged from roughly 20°C to 40°C (36°F to 72°F) between the heights of the cold spell on December 23 and the warm spell on December 30.
The first week of 2023 also brought record-breaking warmth to Europe. A warm air mass from the west coast of Africa shattered thousands of temperature records across Europe, The Washington Post’s Capital Weather Gang reported. On New Year’s Day, at least seven countries saw their warmest January weather on record.
“There’s a common thread connecting all of these temperature extremes. In December, we saw an elongation and weakening of the stratospheric polar vortex in the Arctic—the band of strong westerly winds that circulate between about 10 to 30 miles (16 to 48 kilometers) above the North Pole in winter.”
– Judah Cohen, a visiting scientist at the Massachusetts Institute of Technology and a forecaster with Atmospheric and Environmental Research (AER)
When the polar vortex is strong and circular, it keeps cold air bottled up over the Arctic; when it weakens and elongates, the jet stream in the troposphere also tends to elongate southward and cold air from the Arctic can spill down into the midlatitudes.
“But when the polar vortex ‘stretches’, it doesn’t stay in that configuration for long,” Cohen added. “Like a rubber band, it tends to ‘snap’ back into a circular shape, typically within about a week.” The snapback in early 2023 was a key part of the reason that the jet stream straightened out and why warmer air masses from equatorial regions warmed the eastern U.S. and Europe, according to Cohen.
There’s also a more complicated question that Cohen and other atmospheric scientists who specialize in the stratosphere are researching with growing interest: are these stratospheric polar vortex disruption events—these stretching events—becoming more frequent over time and, if so, why?
After analyzing decades of metrological data using the MERRA-2 weather reanalysis model maintained by NASA’s Global Modeling and Assimilation Office (GMAO), Cohen and colleagues think that stretched polar vortex events have become more common since 1980. In a study published in Science in 2021, Cohen and colleagues linked declines in Arctic sea ice in the Barents and Kara Sea and increases in snowfall in Siberia—both of which are linked to climate change—with an increase in polar vortex disruptions and cold spells in the midlatitudes.
“Not everybody agrees with us. It’s still contested science, but I am confident that we’ll see more and more examples of these stretching events in the stratosphere followed shortly after by cold snaps in the midlatitudes as the Arctic climate warms and changes. The stretching of the polar vortex we saw in December 2022 definitely fits that pattern.”
– Judah Cohen
This post first appeared on NASA Earth Observatory. NASA Earth Observatory video and images by Joshua Stevens, using GEOS-5 data from the Global Modeling and Assimilation Office at NASA GSFC. Story by Adam Voiland.